
In JM Hurst's Cycles Course Hurst presented a trading methodology which consists of a logical process to generate trading decisions from a completed analysis.
The first part of the process involves choosing a "trading cycle". One could get pretty complicated about this, but the simple approach is actually best. When considering a cycle you should answer three questions:
Once you have chosen your trading cycle it is time to start trading.
Looking ahead
An important concept in Hurst's trading methodology is that you need to look ahead towards the next move that the cycle you are trading is going to make. This is very easy to do using Sentient Trader: simply display the multiple FLD Pattern Projection boxes which summarize all of the analysis information into two simple projections:
Unless it is very early in the current move, your focus when making trading decisions should always be on the next move. As a result when the market is falling, you are looking ahead to a long trade to catch the next move up, and conversely when the market is rising you are looking ahead to a short trade to catch the next move down.
Some users find this confusing and complain that Sentient Trader is "trying to buy when the market is going down"! There is nothing wrong ... Sentient Trader is simply following Hurst's guideline to look ahead to the next move.
Underlying Trend
Underlying trend is a very important issue to consider when trading. Because underlying trend is a measure of how longer cycles are moving price, one should only take trades which are supported by underlying trend, in other words:
Note that Hurst recommended using only the "short underlying trend" which considers only two cycles longer than the trading cycle, when making trading decisions.
Enough theory, let's take a look at an example:
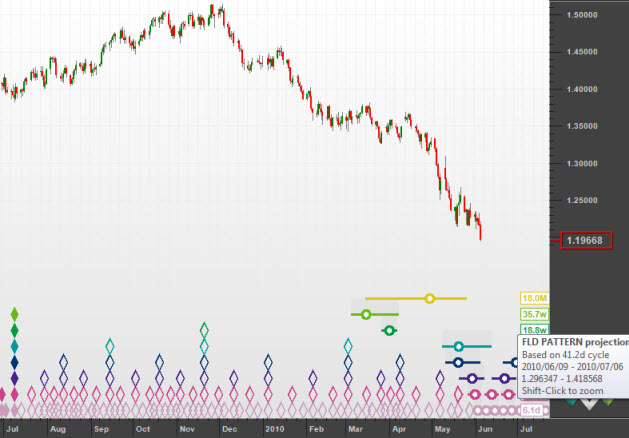
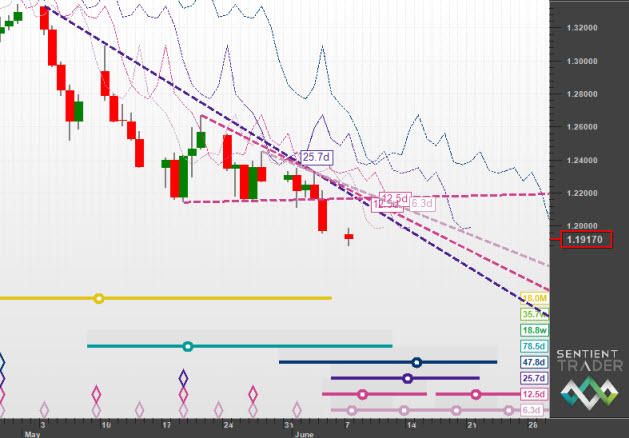
Here is a chart which shows price falling towards a trough of the 18-month cycle (the yellow "circle-and-whiskers").
Before we look at the multiple FLD Pattern Projections (which is shown a little lower down), notice how the longer cycles (20-week to 18-month) are overdue (their circle-and-whiskers are in the past). This is a perfect opportunity to consider a long trade, because of a rule-of-thumb:
Our chosen trading cycle is the 40-day cycle because:
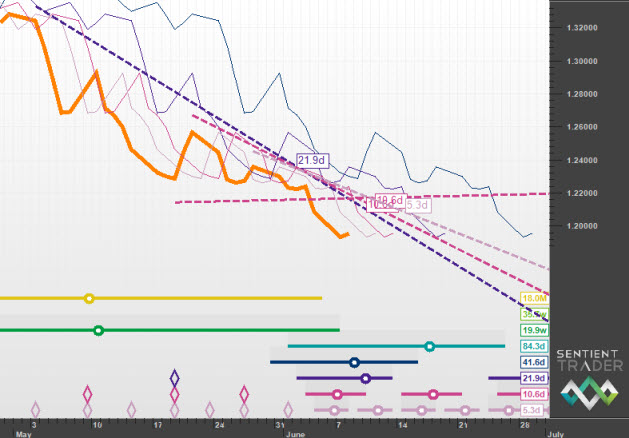
Now let's consider the underlying trend situation. We are considering a long trade following the forthcoming trough of the 40-day cycle. The underlying trend of the next 40-day cycle is positive, because the next trough of the 40-day cycle will be synchronous with longer cycle troughs of the 80-day cycle (add one cycle, making the underlying trend +1), the 20-week cycle (add another cycle, making the underlying trend +2), the 40-week cycle (add another, making the underlying trend +3 - although the short underlying trend doesn't consider this cycle as it only considers two cycles longer than the trading cycle), and the 18-month cycle (add another, making the total underlying trend +4, and the short underlying trend is positive because it doesn't consider this cycle either).
And so we have a positive short underlying trend, and a strongly positive (+4) total underlying trend. Conditions are perfect to consider a long trade.
"Conditions are perfect to consider a long trade" is a bit vague. Let's get serious about this trade and consider two very important statistics:
So let's calculate these two figures. In order to do that we need to have some idea of how much profit we expect to make from the trade, and what the anticipated risk is.
The expected profit for a trade is calculated by working out what the target price is for the cyclic move that you are trading. How do we do that? By using the projections that have been made on the basis of cyclic principles. There are many projections that are generated on the basis of cyclic principles:
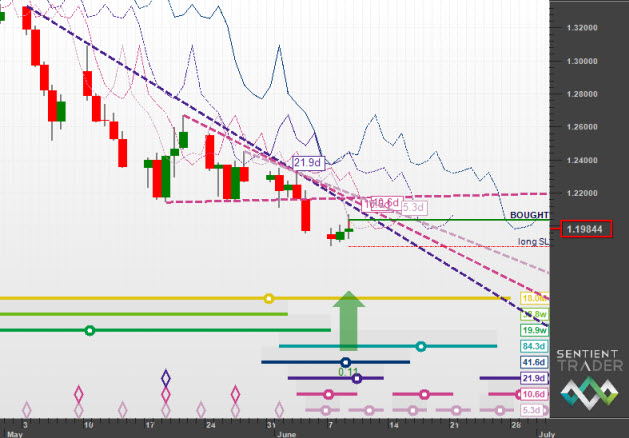
If all that sounds very complicated, let's turn to Sentient Trader to simplify things. After considering all possible projections which could affect the cycle we are trading we want a single price level which represents the level we expect price to reach as the target of this trade. That information is provided graphically to us by means of Sentient Trader's multiple FLD Pattern Projection boxes. (The information is also provided whenever Sentient Trader generates a Trade Order). Simply turn on Sentient Trader's FLD Pattern Projection boxes for the 40-day cycle:
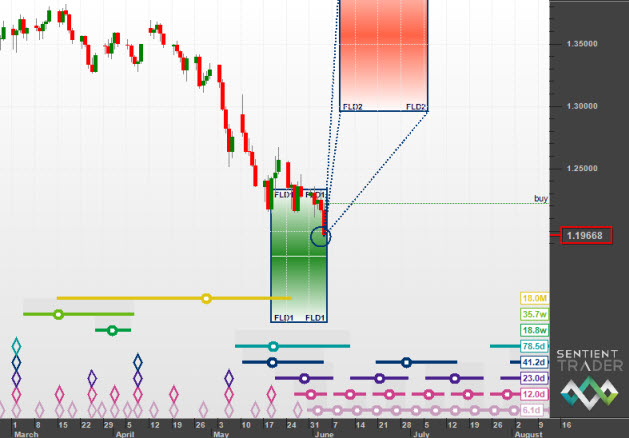
There we have it. The green box is (in simplistic terms) a "buy zone", and Sentient Trader is expecting price to RISE into the red box (the actual target is right in the middle of that box, a little above 1.35).
We also need to know the entry price in order to calculate these figures. The entry price is calculated further on in the process as will be explained. For now let's use the entry price marked on the above chart by Sentient Trader (the green "buy" line), which is at about 1.22100
Finally we need to know the stoploss price (the price at which we would exit the trade if it turns out to be a losing trade). The stoploss price is explained later on, but for now we will place it a little below the low of the last bar, which is at about 1.19600
And so we have approximate details for our trade. Now let's calculate the two figures we need (just in case you're beginning to develop mathematics fatigue you should know that Sentient Trader does this all for you, so you could always skip ahead and let Sentient Trader handle the details).
Profit Potential: The profit potential is a percentage figure representing the percentage of you original investment that will be returned as profit when the trade reaches maturity and achieves its target. The actual figure depends upon your broker, the type of account you are trading, the value per tick, and what degree of leverage (if any) you are trading with. For the purposes of this example we will assume that:
Therefore we can calculate the profit potential as follows:
Initial value of investment: $2,500 (per contract)
Expected profit from trade: (target - entry price expressed in ticks) x (value of
1 tick)
====================> (1.35000 - 1.22100 as ticks) x ($0.10)
====================> (0.12900 as ticks) x ($0.10)
====================> (12900 ticks) x ($0.10)
====================> $1,290.00
Therefore, from an original investment of $2,500 we expect to make a profit of $1,290. That is a profit potential of 51.6% which is well above our minimum 20% requirement. So far this trade is looking good.
Profit: Risk ratio: The PR ratio is the ratio between the expected profit to be made from the trade, and the anticipated risk that we are taking with the trade. The risk is the amount that we could lose, and is therefore the difference between the entry price and the stoploss price (the price at which we would exit the trade if it turns out to be a losing trade). Note that this is the theoretical risk - there is additional risk in that you might not actually be "stopped out" at the price that you set as your stoploss.
The PR ratio is calculated as follows: (Expected Profit):(Expected Risk)
===========================> (target - entry price):(entry price - stoploss)
===========================> (1.35000 - 1.22100):(1.22100 - 1.19600)
===========================> (0.12900):(0.02500)
===========================> 5.16:1
That PR ratio of 5.16:1 means that our expected profit is more than 5 times greater than the risk we are taking. That is well above our minimum PR ratio of 2:1, and so we would decide to go ahead with this trade.
Let's go back to that green buy line in the chart above. That is a trading order that Sentient Trader has generated ... let's discover how and why it did that.
What we need to do is get from "considering a long trade" to actually taking a long trade. To do that we make use of cyclic tools.
Cyclic Tools
There are two cyclic tools that we use to inform an analysis, and to make trading decisions. They are the FLD (Future Lines of Demarcation) and the VTL (Valid Trend Line). These tools are used to confirm that a trough or a peak of the cycle being considered has been formed in the price movement.
Of course when making trading decisions we want to enter a trade when we are convinced that the trough (or peak for short trades) of a cycle has occurred, and so we make use of the same cyclic tools to make trading decisions.
Let's go back to our example to demonstrate:
We have established that we are considering entering a long trade. How do we move from "considering" the trade to making the trade? By identifying what cyclic event needs to occur in order for our trade to be valid. And in this example the cyclic event that needs to occur is that a trough of the 40-day cycle needs to form in price so that we can enter our long trade, and profit from the upwards movement in price that will follow the the 40-day cycle trough (the trough of our trading cycle).
Now how do we know when the "cyclic event" of the formation of the 40-day cycle trough has occurred? By using FLD's and VTL's. In fact to be exact:
(If you think that 20-day VTL is a mistake, review the difference between FLD and VTL information).
So let's take a look at the levels of the FLD's and VTL's:
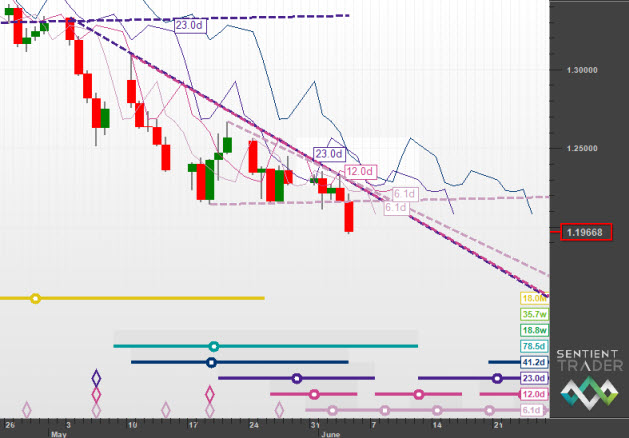
The FLD and VTL lines are colored according to the color of the cycle they belong to.
OK, so we know that if price crosses those levels the trough of the 40-day cycle will be confirmed. Let's step forward in time and look at the situation at the end of trading on Monday 7 June:
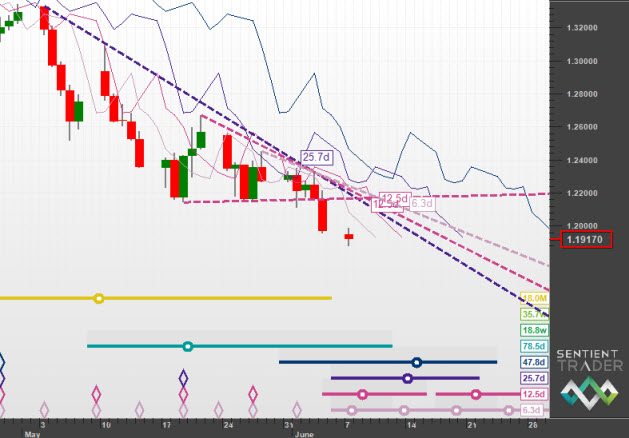
Price has fallen further. The levels at which the 40-day cycle trough would be confirmed should price cross them on the next day of trading are:
Notice something? Price is actually falling further away from the level at which we could confirm that the trough has occurred. And there is something else that might be worrying you: when price crosses an FLD, half the move is already over! Is it really necessary to miss half the move that we hope to profit from? Can we not confirm that the trough has occurred any sooner? VTL's will usually confirm earlier than FLD's, but they aren't always available (because of the rules for the construction of VTL's).
Yes, in fact we can confirm the trough sooner, and No, it is not necessary to miss half the move before confirming that the trough has occurred. The solution is inherent in Hurst's Cyclic Principles, in particular the Principle of Synchronicity and the Principle of Harmonicity. There is a logical process which is very important to understand:
Here are those levels:
Those levels are much closer to price, and therefore would confirm the trough sooner, and potentially get us into the long trade at a better price. But why stop there? We can repeat the logical process above:
Here are those levels:
And so we could continue with the same reasoning. For the sake of completeness, here it is:
Here is that FLD level:
OK, so that means that if price crosses the 5-day FLD level (at about 1.2020) we will be able to confirm the formation of the 5-day, 10-day, 20-day and 40-day trough. That means that we will have the confirmation we need to validate our long trade.
However before we proceed it is very important that you understand an important aspect of the above logical process. That is the answer to the question: How many cycles down can I go? Should I stop at the 20-day cycle, the 10-day cycle, or go all the way down to the 5-day cycle? (If you are working with the intraday version of Sentient Trader you could theoretically go all the way down to the 3-minute cycle, which highlights the importance of this question.
OK, so now we have determined several levels (all those FLD & VTL levels given above) at which we would receive confirmation of the formation of the 40-day cycle trough. That is great, but how do we trade with this information? This is where Hurst's Action Signals come into play. An Action Signal consists of two parts:
And so in our example we could create an action signal to turn our assessment of a potential long trade into an actual long trade. Here is a potential action signal:
But now there is another level of complexity that we must introduce. You will recall (we hope!) from the discussions of FLD's and VTL's that the confirmation of a trough or peak occurs when the median price crosses the line.
The median price is the mid price between the high and low of the bar. Of course this means that the median price is only known after the bar is complete. Therefore price crossing an FLD or a VTL will only be known to you after the trading for a particular bar is complete.
That is OK, because there are two types of action that can be taken by an Action Signal:
And therefore because the above action signal is based upon a median price which is only known to us (and Sentient Trader) after the bar completes, it must of course be a delayed action signal, and so is better expressed as:
This is called a delayed action signal (and is marked on a Sentient Trader chart by the letters "dly" after the action type, such as "buy (dly)").
This is all very well, but we can be more aggressive in our trading approach (if we want to be), and instead of taking delayed action which inevitably means missing some of the price move, we could take immediate action, by creating an immediate Action Signal. However doing so with FLD lines based upon the median price makes no sense, because those FLD lines relate to the median price. What price could we use to create immediate trading actions? The answer is the High and Low prices . That's why it is possible in Sentient Trader to plot FLD lines based upon the High price and the Low price. Hurst recommended creating immediate Action Signals based on these prices in the following way:
Let's take a look at a chart with the FLD based on a HIGH price plotted on it:
The 5-day FLD based on High price is (of course) higher than the FLD based on Median price, and is at about the 1.2180 level for the next day of trading. Here is an Action Signal that we could create with the 5-day FLD:
Note that the action is immediate, and the way in which this is achieved is by instantly converting the Action Signal into a Trade Order, which can be placed with your broker. This type of order is called a stop order because it is an order that should be triggered at a price beyond current prices in the direction of the trade, in other words above price for a long trade, and below price for a short trade.
Here is the Trade Order that would result from the above Action Signal:
And there we go! We have turned our consideration of a trade into an actual trade order, which will result in a trade if price reaches the critical level defined by the 5-day FLD (or other critical level that you may have chosen).
Now let's step forward in time again, and take a look at the median price chart to remind ourselves that a trough is only confirmed when the median price crosses an FLD or VTL:
And so the trough has not yet been confirmed. Although you cannot see it on the above chart, price did not cross our immediate Action Signal and Trade Order level of 1.2180 either.
And so what happens? Well our Trade Order will be cancelled, because it was not executed, and we will make revised trading decisions for the next bar. The 5-day FLD (High) for the next bar is at the 1.2020 level, and so we generate a new Trade Order (to replace the previous one):
Let's step forward another day, and see what happened:
Price did in fact rise to the 1.2020 level, and so our stop order (which would have been placed with a broker) has been executed, and Sentient Trader now displays our long position (meaning that we have bought) on the chart.
The first thing that should be done when entering a trade according to cyclic principles is to decide at what level we would want to exit the trade (sell the instrument in the case of a long trade) if price does not move as expected, but instead moves in the opposite direction. This is called a stoploss order (because it stops your loss).
In fact the stoploss level (the price level at which the stoploss will be set) is always determined prior to placing the trade (which is how we were able to use it in our calculation of the PR ratio). Most online trading platforms nowadays also allow you to enter the stoploss level when entering the entry order.
Choosing a stoploss level is very simple:
The stoploss level is the price level at which the cyclic reasoning that the trade was based upon is invalidated
Our cyclic reasoning when taking this trade is simply that the 40-day cycle trough has occurred, at the price low of 7 June. How would that reasoning be invalidated? If price quickly dropped below that level, then we would change our minds and say that the 40-day cycle trough has not yet occurred, and therefore our cyclic reasoning behind the trade would be invalidated.
And so where would we set the stoploss level? It would be set a little below the level of the trough that we believe to be the trough of the 40-day cycle (we don't place it at that level because price could return to the level without invalidating the reasoning). In our example the trough occurred at 1.18758, and so the stoploss has been placed at 18755 (as can be seen by the red line with the words "long SL" printed over it).
When we first considered making this trade, we used a target as an estimate of how much profit we could make from the trade. It is possible to create a Trade Order that will exit the trade at that level, thereby taking the full profit home. The disadvantage to this of course is that if the target turns out to have been conservative, then closing the trade means you miss out on any further price move in the direction of your trade.
Setting "Take Profit" exits is very much a matter of personal choice. You can use a trade setting (Tools > Trade Settings > Advanced > Set Take Profit exit) to determine whether take profit exits should be generated or not. If you choose to set Take Profit exits, Sentient Trader will adjust the exit level according to its latest calculation for the projection of the price move you are trading on after each bar's updated analysis.
Let's continue with our example, and see what happened after some time:
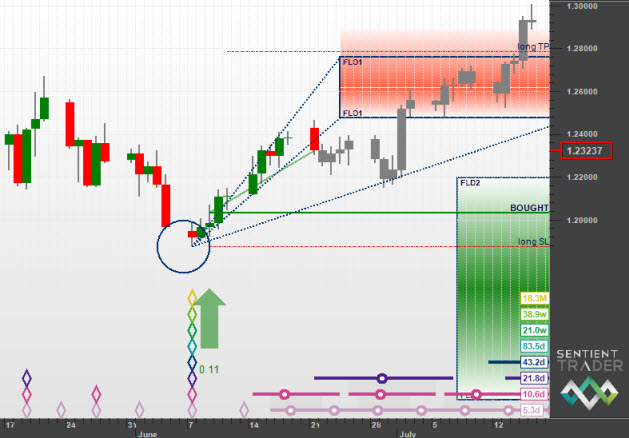
This is the status after close of trading on 21 June, two weeks after the 40-day trough which "triggered" our long trade.
Having entered a trade, it is important to monitor the progress of the cyclic picture until exiting the trade.