
Sentient Trading methodology is based upon, and extends the trading methodology that JM Hurst proposed in the JM Hurst Cycles Course, and so a thorough understanding of that methodology is recommended.
The Sentient Trading methodology is all about the character of a financial market.
What do we mean by "the character" of a market?
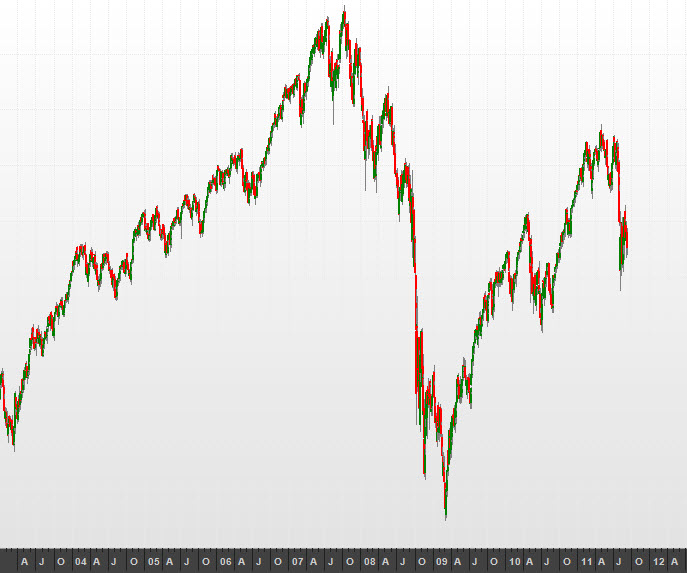
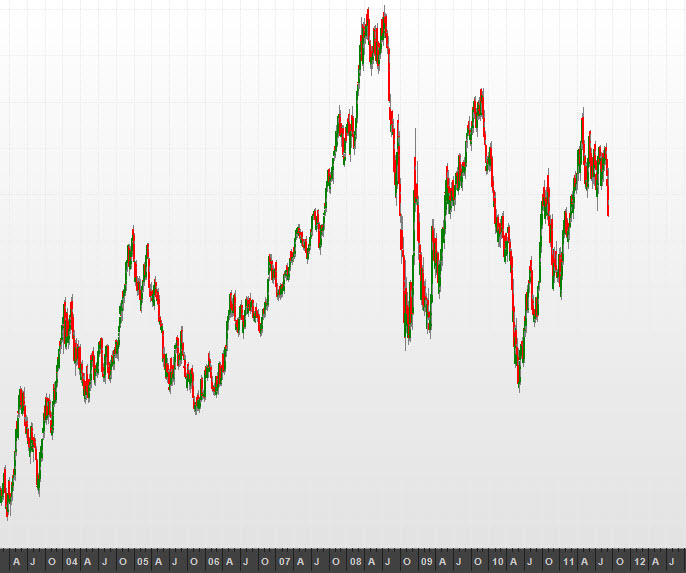
If an experienced trader is shown a chart of a forex pair, a chart of a stock index and a chart of a commodity they will be able to tell them apart. Try it for yourself:
 |
 |
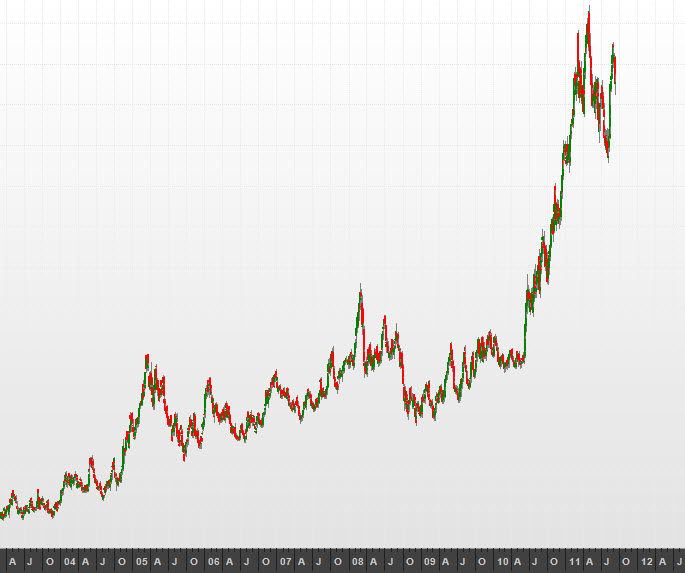 |
Can you tell which chart is the stock index chart? And if so, why? How could you (or an expert) do that? Because the three markets have different "characters". In other words the price movement is different. Most experienced traders would be hard-pressed to describe exactly what the difference is. They would probably mutter things like "volatility", "support & resistance", "classic patterns", and so on. All of those are things that describe the character of a particular market, and make it possible to distinguish charts betwen instrument types, sometimes even between different sectors of the same general instrument class.
What does this have to do with Sentient Trading?
Well, an analysis performed on the basis of cyclic principles results in a breakdown of the price movement into many different cycles. Now the character of any market is simply the character of the price movement, and that can be seen very simply as the shapes of all the cycles that make up the price movement. And so put another way:
The character of a market can be defined by studying the shapes of the cycles as traced out by the price movement.
OK, so what? Well, we are trading the cycles, in other words buying when the cycle moves up and selling when the cycle moves down (excuse the over-simplification!). Now if we know that in a particular market the shapes of the cycles are different, then we can trade the market more effectively, by trading in a manner that suits the character of the market, by making trading decisions optimized for the shapes of the cycles we are trading.
So how do we "trade in a manner that suits the character of the market"? How do we actually know the character of the market? Do we also use vague muttered terms?
No. We are able to define the character of a market very specifically. We do this by classifying the shapes of the cycles that are found in the price movement, and then calculating statistics about those cycles. (I say that "we" do it: in fact Sentient Trader does it!)
Classifying the Shapes
When introducing people to the concept of cycles in the market, I always pull out this old chestnut:
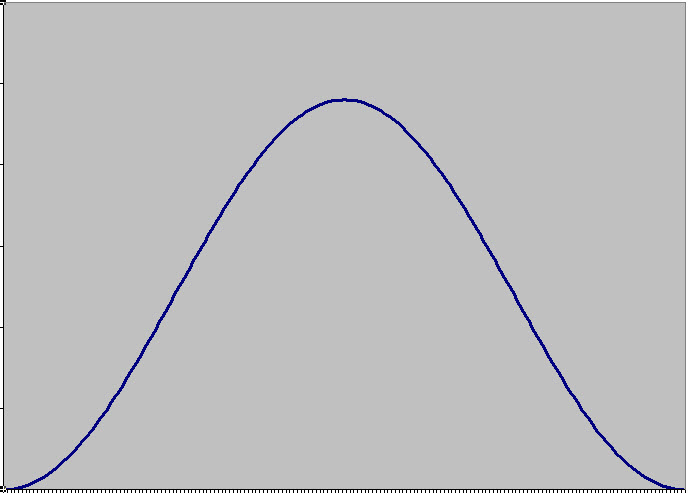
That is a single cycle (or wave) of a sine curve, which is generally used to explain a single cycle's effect on the price movement of a market, causing it to rise from a trough, reach a peak and then fall again to the next trough, a process which is repeated again and again.
That's all very well, but a fundamental aspect of Hurst's Cyclic Principles is that price movement is the result of many cycles (an infinite number actually) working together. And the Principles describe how they work together. At the most basic level let's consider the combination of two cycles:
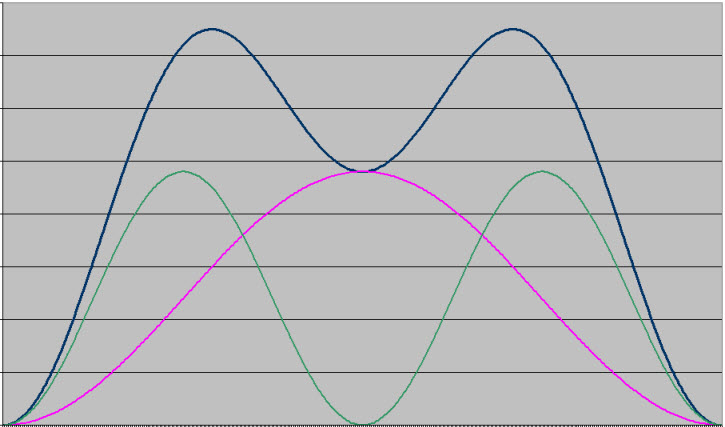
In this picture the pink and green cycles combine to produce the resultant "price movement" - the blue line.
Now we know that there are an infinite number of cycles, and therefore every cycle has a shorter cycle, and so in fact in the markets a cycle never has the shape of a single sine wave, it always has the shape illustrated above, or a more complex variation of that shape.
Should we consider further shorter cycles? No. The reason is that shorter cycles create a fractal of the above illustration in ever smaller steps, but the basic shape illustrated above is not changed.
And so when we are considering the shapes of cycles in the market we are considering the arrangement of four periods of price movement (as opposed to only two), as indicated here:
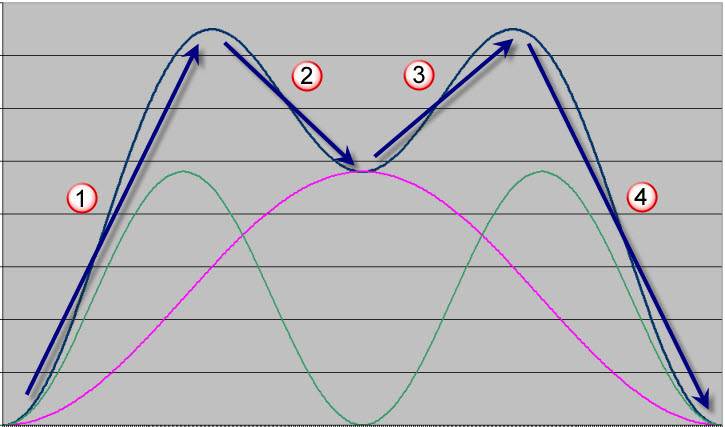
How many ways can these four periods of movements (called legs, or waves) be arranged? There are 16 and only 16 possible combinations of these four waves. These are called the Wave Shapes, and they are listed below.
Wave Statistics
Having classified the cycle shapes that are found in the market we have completed the first step. The next thing to do is learn more about these wave shapes. We do that with statistics. For each type of wave shape for each cycle Sentient Trader calculates the following statistics:
That's very interesting information, but there is a further subtlety that Sentient Trader adds. These statistics are also calculated for various different conditions of underlying trend. When you are trading, you know the expected underlying trend of the cycle you're trading (assuming the analysis is good). Therefore (with the help of Sentient Trader) you can say with some confidence what sort of shape is expected for the cycle you're trading.
Accessing these statistics is very simple: use the menu View > Sentient Wave shape statistics
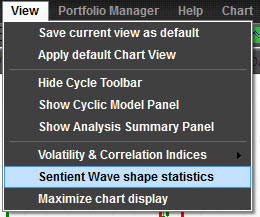
And Sentient Trader will present them to you:
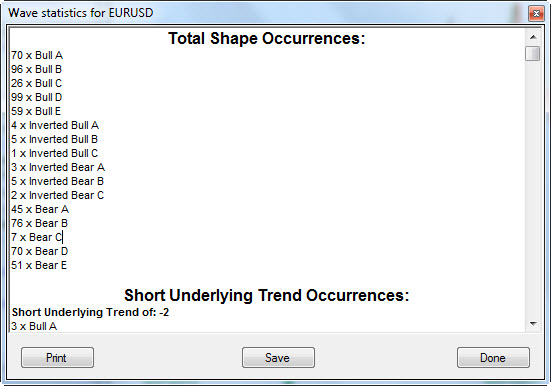
You can Print or Save them. If you Save them Sentient Trader will create a .csv file of the statistics which can then be opened in a spreadsheet program such as Microsoft Excel.
Trading results
Statistics are a whole bunch of numbers, the sort of thing that the Sentient Trader application loves, but as a Sentient Trader yourself they are likely to leave you cold. There is another, much more real way of knowing the character of a market, and that is by actually trading it.
An additional way therefore to understand the character of a market is to study the way in which it responds to the Sentient Trader methodology when trading. You don't have to do that in real-time, you can build a trading history in Sentient Trader, the purpose of which is reveal the character of the market.
It is usually easier to understand the character of a market in terms of "Wave One with a positive underlying trend yields a 65% win ratio" than with statistics: "Wave One with a positive underlying trend generally lasts for 15 bars, and produces a price move of 18%". With Sentient Trader you can do both.
Here are the 16 cycle shapes that are defined in the Sentient Trading method:
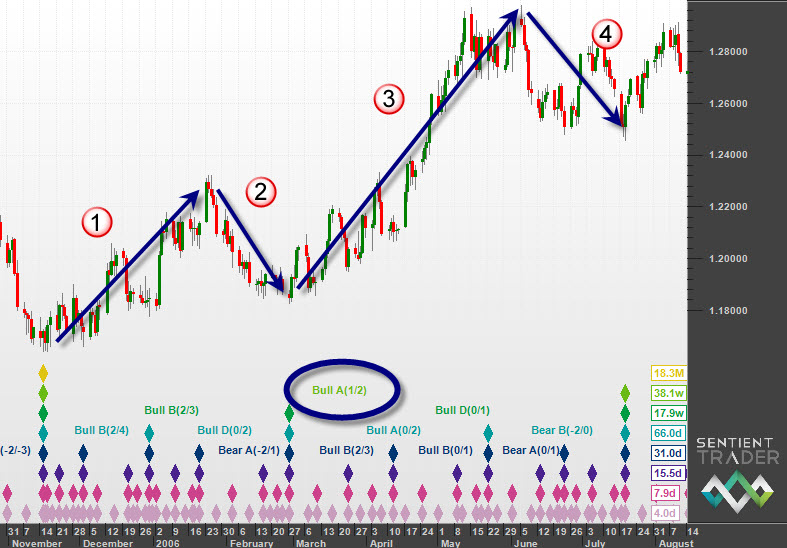
Bull shapes are cycles that end higher than they start. There are five possible formations, and here they are presented in descending bullishness order (in other words Bull A is a more bullish wave than Bull E):
Bull A
Wave 3 carries price to a higher peak, and wave 4 ends above the peak between wave 1 & 2.
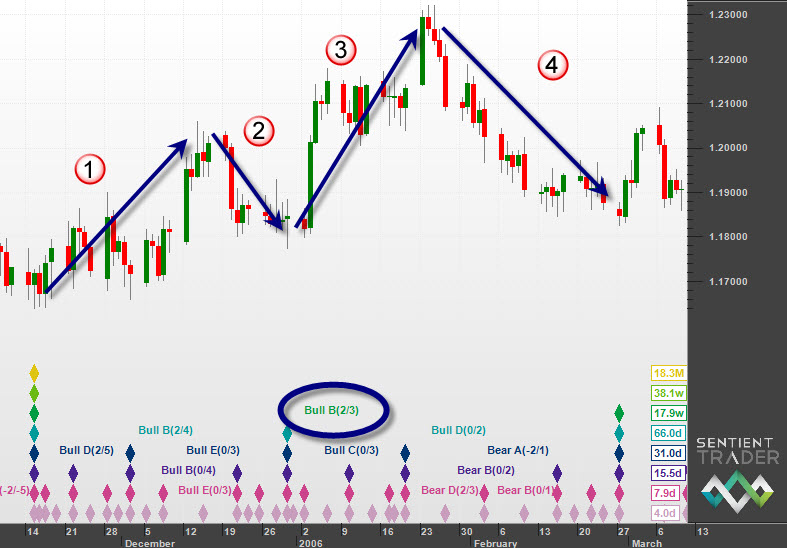
Bull B
Wave 3 carries price to a higher peak, and wave 4 ends below the peak between wave 1 & 2, but above the trough between wave 2 & 3.
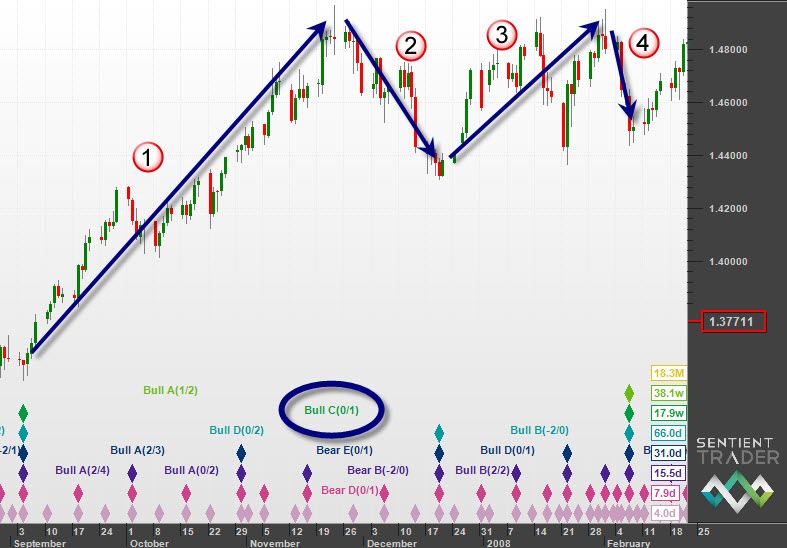
Bull C
Wave 3 does NOT carry price to a higher peak, and wave 4 ends above the trough between wave 2 & 3.
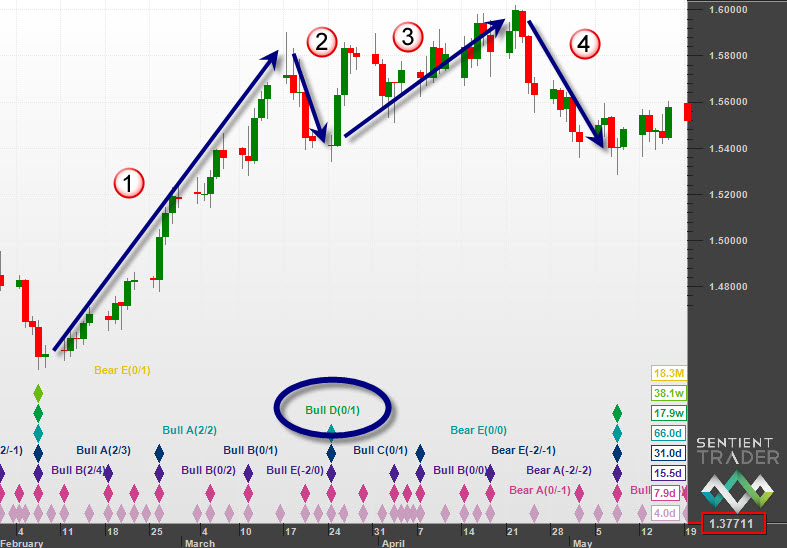
Bull D
Wave 3 carries price to a higher peak, and wave 4 ends below the trough between wave 2 & 3.
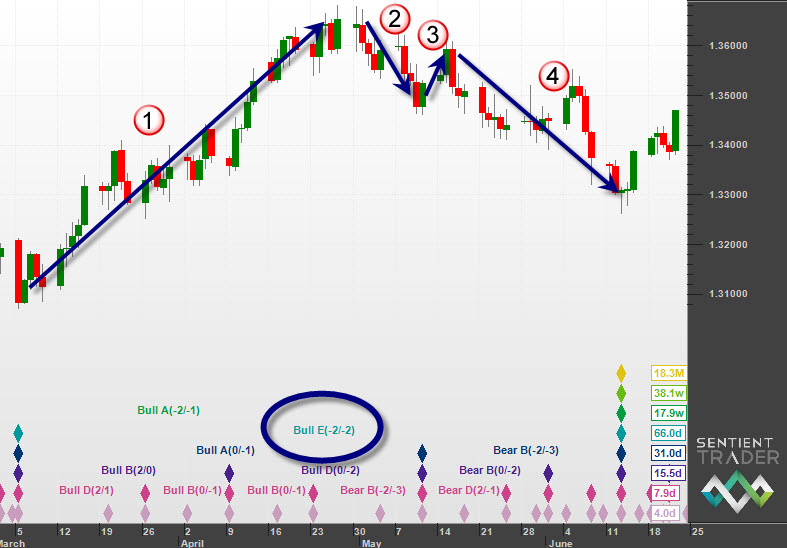
Bull E
Wave 3 does NOT carry price to a higher peak, and wave 4 ends below the trough between wave 2 & 3.
Bear shapes are cycles that end lower than they start. There are five possible formations, and here they are presented in descending bearishness order (in other words Bear A is a more bearish wave than Bull E):
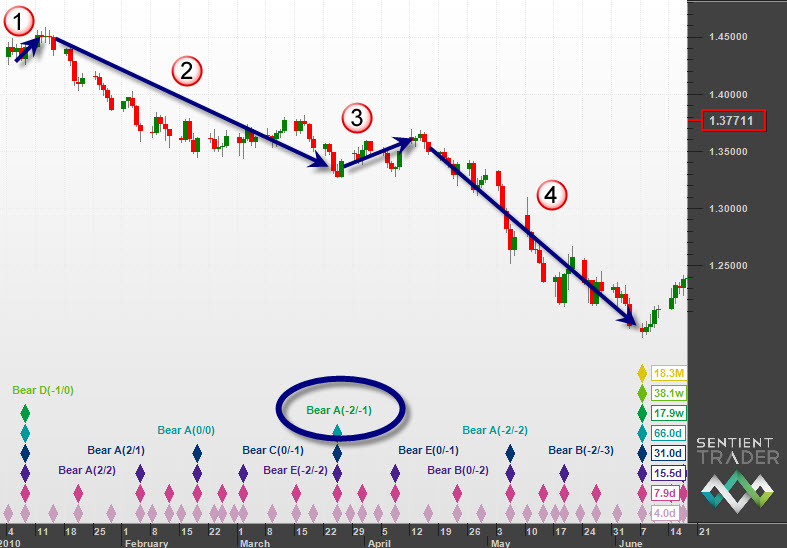
Bear A
The trough between wave 2 & 3 is below the starting level of the cycle. Wave 3 fails to bring price back up to the starting level of the cycle.
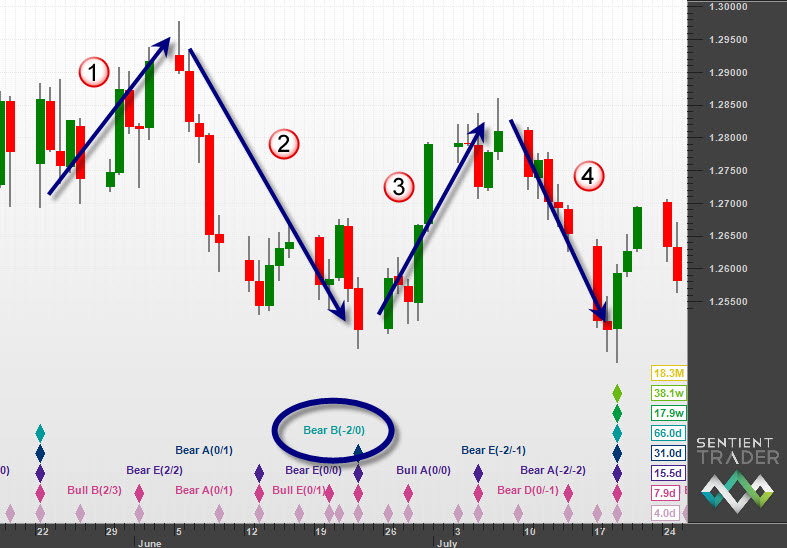
Bear B
The trough between wave 2 & 3 is below the starting level of the cycle. Wave 3 DOES bring price back up above the starting level of the cycle, but not above the peak between wave 1 & 2.
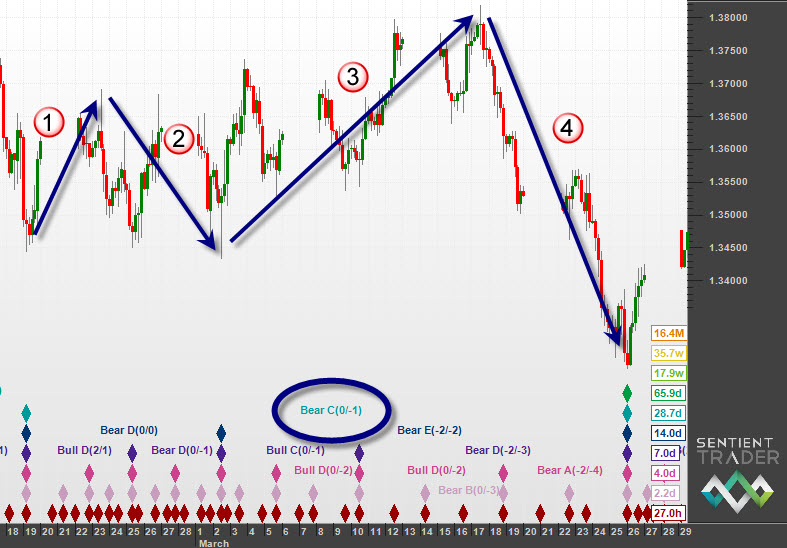
Bear C
The trough between wave 2 & 3 is below the starting level of the cycle. Wave 3 DOES bring price back up above the starting level of the cycle, AND above the peak between wave 1 & 2.
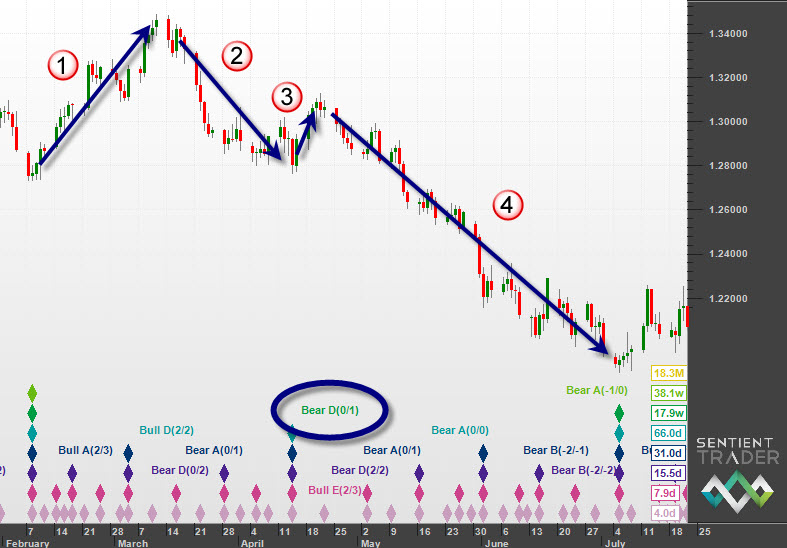
Bear D
The trough between wave 2 & 3 is above the starting level of the cycle. Wave 3 does not carry price above the peak between wave 1 & 2.
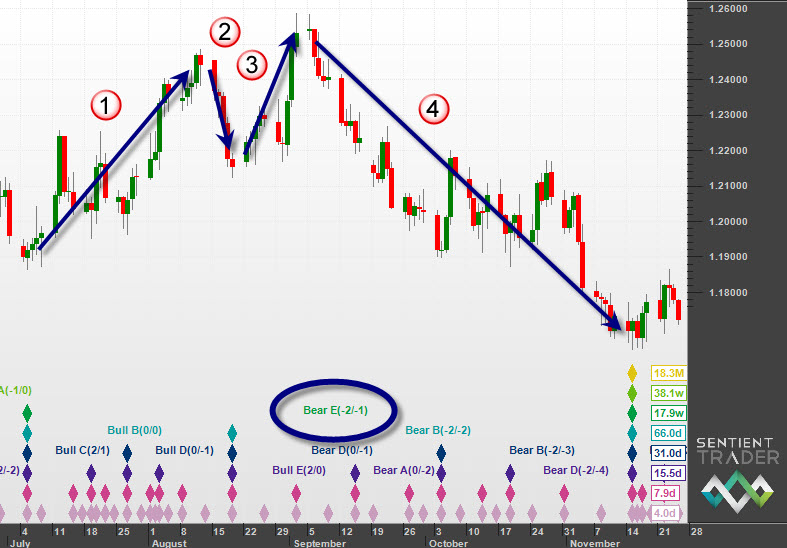
Bear E
The trough between wave 2 & 3 is above the starting level of the cycle. Wave 3 DOES carry price above the peak between wave 1 & 2.
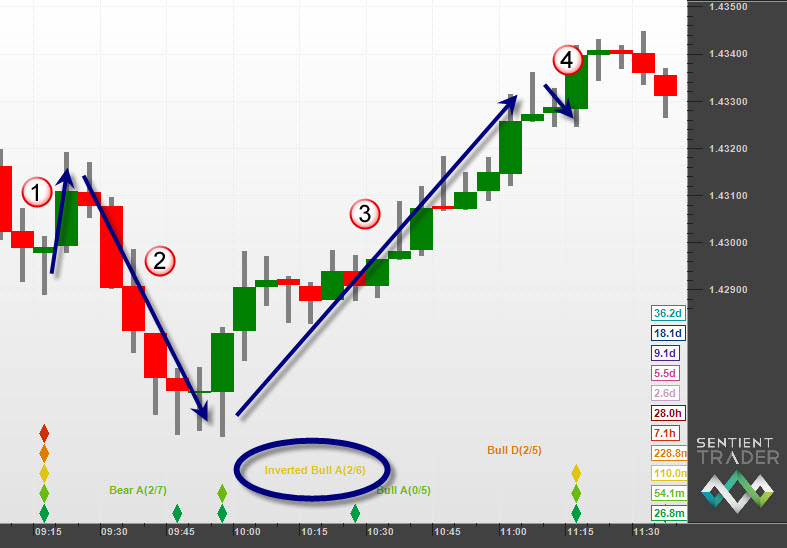
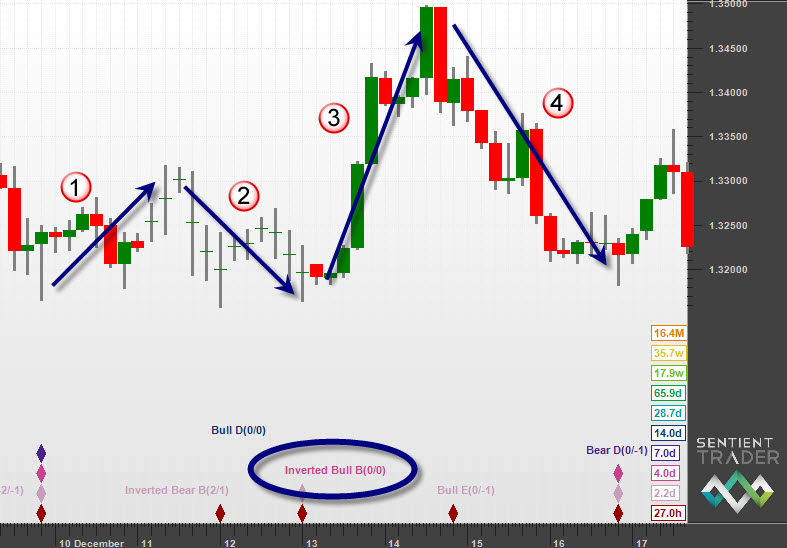
Inverted shapes are cycles whose mid-points (the intervening trough of the cycle one degree shorter) is lower than both the start and end of the cycle. Inverted shapes are always an indication of a weakness in the analysis, and they are not genuine cycle shapes, but represent an unresolvable situation in the analysis. For this reason they are fairly difficult to find, and you will see that our examples often span weekend or non-trading periods, the data for which is artificially generated by Sentient Trader, and inverted shapes are often accepted over these periods because of the artificial nature of the data.
Note that inverted shapes almost always have inverted shapes in the shorter cycles that make them up, leading to a "thread" of inverted shapes that sometimes occurs in an analysis (and is often the result of fundamental interaction).
There are six possible formations:
Inverted Bull A
Inverted Bull B
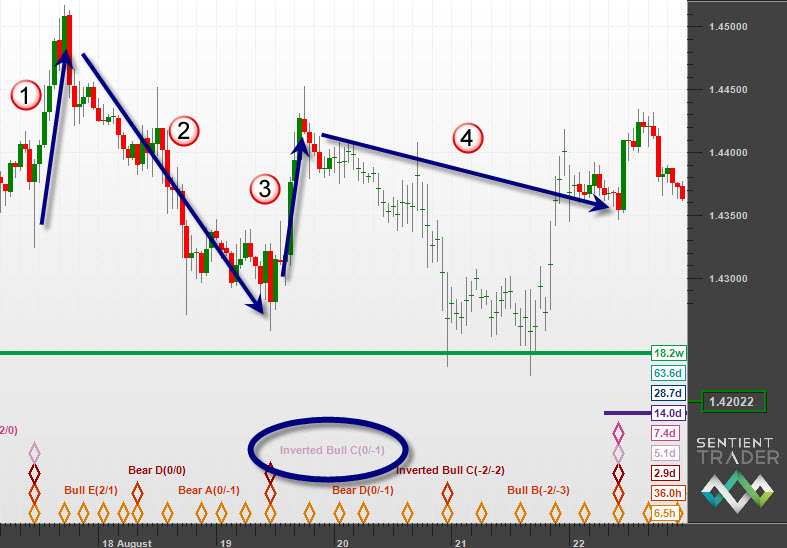
Inverted Bull C
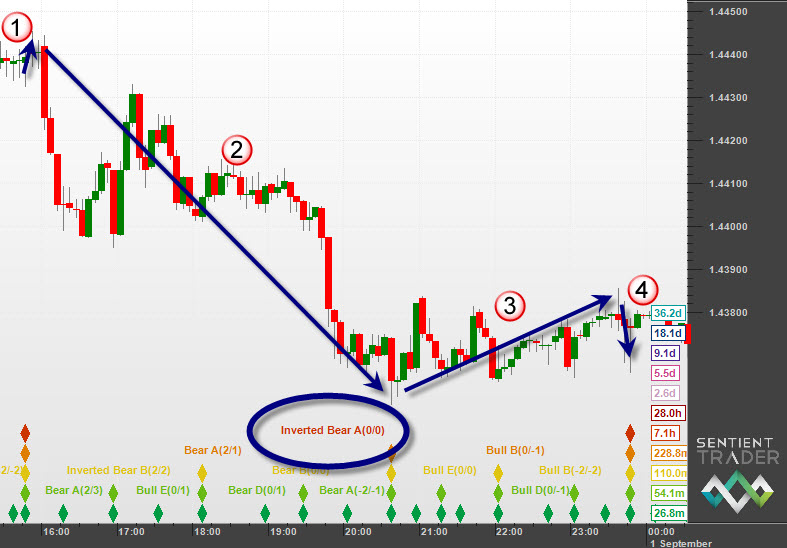
Inverted Bear A
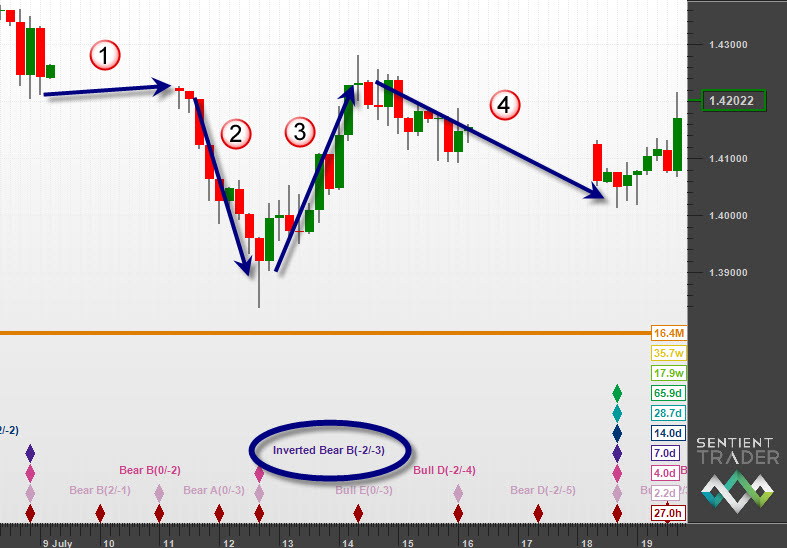
Inverted Bear B
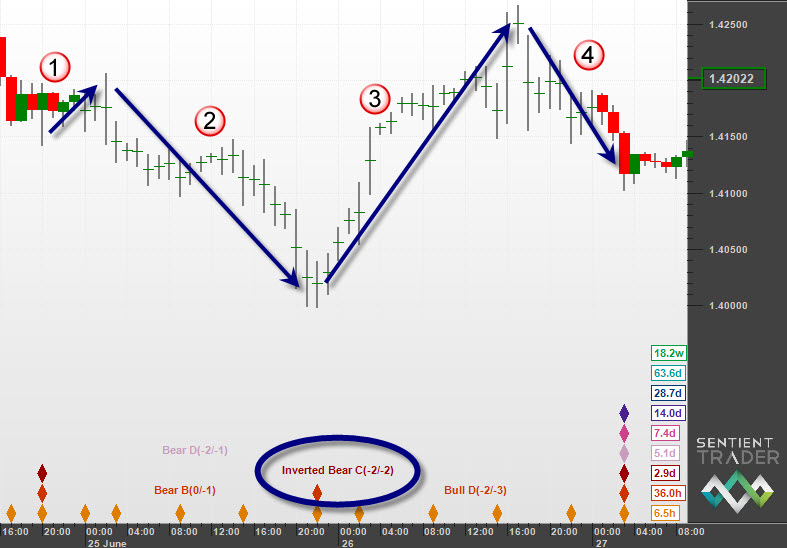
Inverted Bear C
What about all the other details of trading using the Sentient Trader methodology?