
A very important use of FLD's is in the observance of the patterns that multiple FLD's (the FLD's of many different cycles) form.
There are in fact only three basic patterns:
Each pattern has some subtle variations which will be explained in the discussion of each type.
In each of the patterns gaps might appear. Gaps are simply areas of the chart in which no FLD's are found, and they are visually apparent as gaps in the pattern! They are important features of a pattern because they affect the implication of the pattern profoundly.
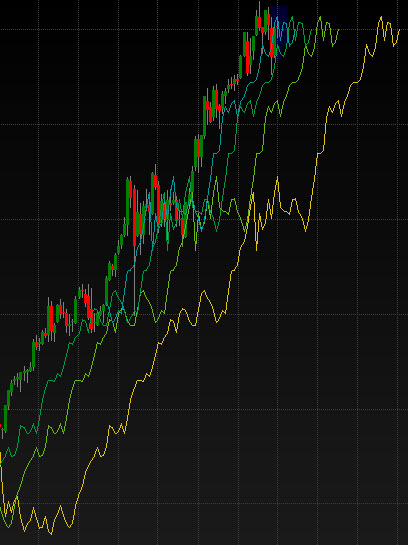
Cascading patterns are patterns formed by multiple FLD's which are running in parrallel, and which maintain a constant distance from each other. Cascading patterns tend to form during strong trend moves in the market.
Cascading patterns suggest the opportunity for a strong move in the opposite direction, and the longer they persist the more likely that move becomes.
A long-term cascading pattern (with a consolidation pattern in the center):
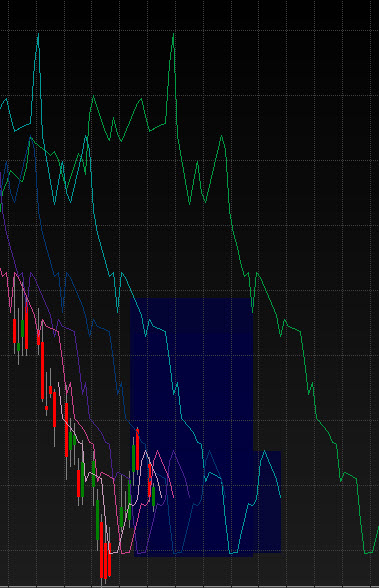
A short term cascading pattern (with a Pause Zone caused by longer cycles, the FLD's of which are not plotted):
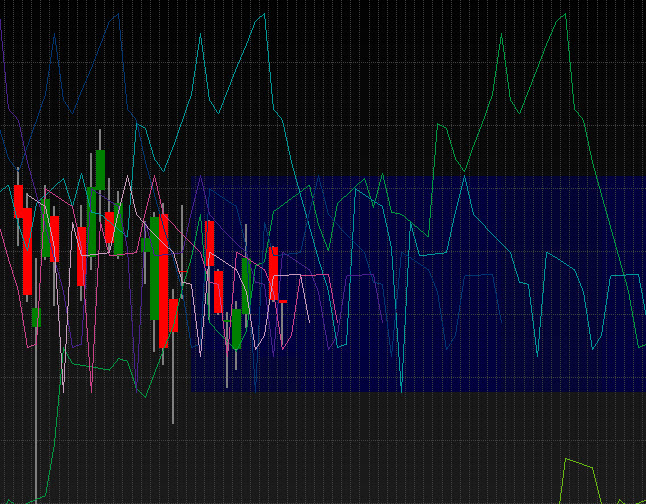
Consolidation patterns are patterns formed by multiple FLD's which are moving against each others direction, within the same price range, and often reverse direction so that they traverse the same price range several times, overlapping one another. They tend to look like a tangled mess on the chart.
Consolidation patterns create Pause Zones. These are price zones in which price is likely to pause, or the development of a strong trend will hesitate.
Pause Zones can themselves be used to generate price projections (and are used by Sentient Trader). When price breaks out of a Pause Zone it is likely to travel as far beyond the Pause Zone as the distance from the most recent peak or trough to the center of the Pause Zone. Pause Zones are displayed in Sentient Trader as translucent blue shapes which are displayed whenever the FLD's are displayed on a chart (because they are of course the result of FLD patterns).
A consolidation pattern (and the Pause Zone):
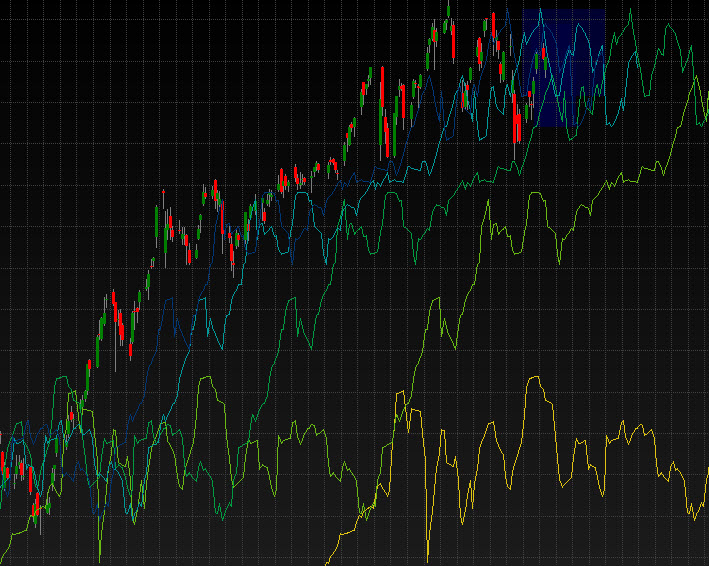
By far the most common pattern found on a chart is a combination pattern. This is very simply a combination of one or more cascading patterns with one or more consolidation patterns.
Combination patterns are described according to the cycles that form constituent patterns, such as:
A cascading pattern of the 5-day to 20-day cycles, and consolidation pattern of 40-day to 20-week cycles, and a cascading pattern of the 40-week and 18 month cycles.
A combination pattern which includes a 40-day to 20-week consolidation pattern and a 40-day to 40-week cascading pattern:
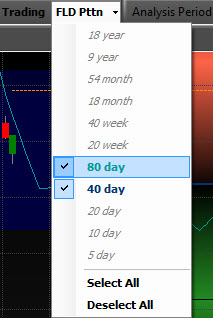
The implication of multiple FLD patterns is of course of more interest than their identification. Sentient Trader calculates an FLD Pattern Projection for each cycle which is a projected price move implied by the multiple FLD pattern, within the context of each cycle. These FLD Pattern Projections can be displayed or hidden by using the FLD Pttn button in the toolbar. As many Pattern Projections as you like can be displayed on the chart.
Multiple FLD Pattern Projections are the implication of the FLD Patterns found on the chart. This is how they are calculated:
By following the logic of this process you will understand why cascading patterns tend to produce strong projections, because each FLD projects price to a position beyond the next FLD in the cascading pattern, which then in turn projects price beyond the next FLD in the pattern, and so on.
On the other hand the logic of this process also explains why consolidation patterns produce Pause Zones. Because of the nature of consolidation patterns, the FLD's tend to project price move in contrasting directions, resulting in a pause in the trend of price.