Once you have created a portfolio you will want to see how the portfolio performed.
Open the Portfolio Report with the menu Portfolio Manager > View Portfolio Report.
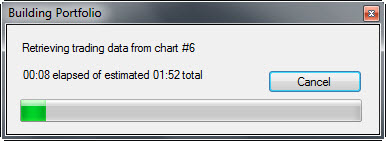
Sentient Trader will then compile the portfolio report for you. This is a process
which requires the building of the portfolio from the individual charts, and so
it can take a few minutes depending on how many charts are included in the portfolio,
and how fast your computer is.
The Portfolio Report is then presented.
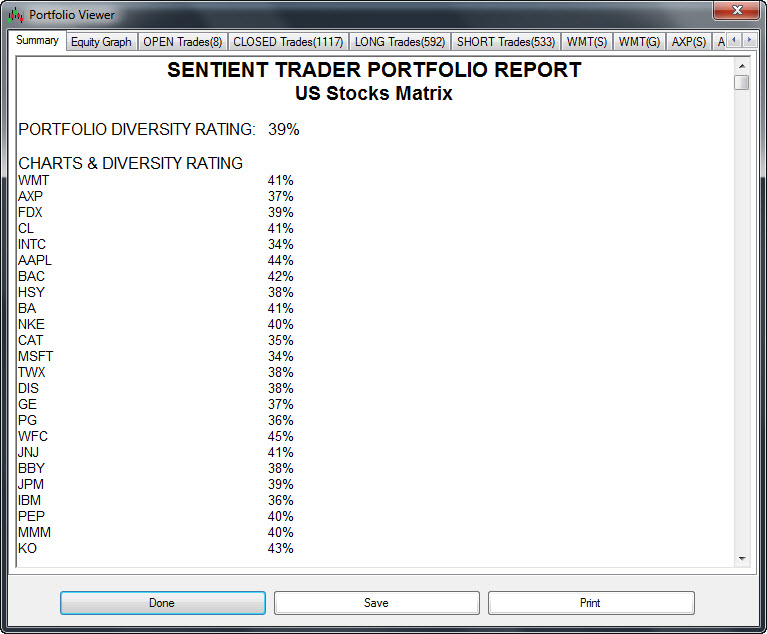
There are many tabs at the top of the Portfolio Report:
Summary: this page presents a summary of the trading of the entire
portfolio.
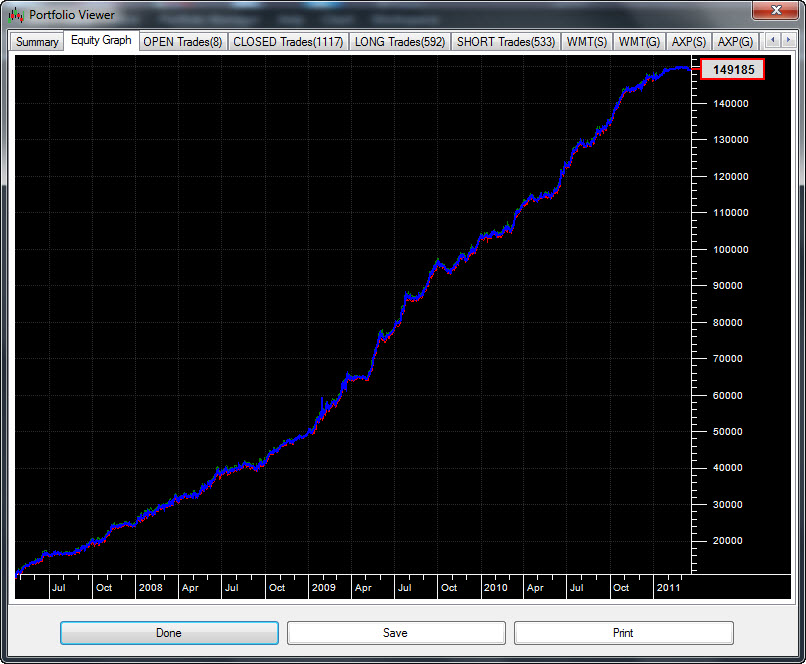
Equity Graph: this is a graph of the equity (balance) of the portfolio.
OPEN Trades: all open trades are presented in tabular format.
The number in brackets in the tab indicates how many trades there are.
CLOSED Trades: all historical (closed) trades are presented in
tabular format. The number in brackets in the tab indicates how many trades there
are.
LONG Trades: all historical long trades are presented in tabular
format. The number in brackets in the tab indicates how many long trades there are.
SHORT Trades: all historical short trades are presented in tabular
format. The number in brackets in the tab indicates how many short trades there
are.
CHART NAME (S): This is the summary page for the chart whose name
is given in the tab (the name of the chart is the symbol of the instrument by default).
There is a summary page for each chart in the portfolio. This page is very similar
to the summary page of the Trading Report of the
chart.
CHART NAME (G): This is the equity graph for the chart whose name
is given in the tab (the name of the chart is the symbol of the instrument by default).
There is an equity graph for each chart in the portfolio. This page is very similar
to the equity graph of the Trading Report of the
chart.
The Summary
The summary page presents a great deal of information about the portfolio.
Diversity Rating
One has to be very careful when trading a portfolio of instruments that they aren't
all too closely correlated, and thus tend to move in the same direction at the same
time. If this happens then one would probably make similar trading decisions on
each instrument at the same time, which is all very well when the trading decision
results in a profit, but is not a good thing when the trading decision results in
a losing trade, because one would then lose money on all the correlated instruments.
For this reason it is very important to understand how well diversified a portfolio
is, in other words how diverse are the instruments that one is trading? Sentient
Trader uses a unique method for calculating the diversity of a portfolio, which
reflects the true diversity of the portfolio, in other words how it affects
you as the trader. This is how the diversity is calculated:
On each and every bar Sentient Trader considers each chart.
If a profit was made on that bar then no calculation is made.
If there was no profit or loss made on that bar then no calculation is made.
However if there was a loss made on that bar then Sentient Trader considers each
and every other chart on that bar:
If a profit was made on that bar, then that is considered a positive thing, and
the chart gains a positive diversity rating.
If no profit or loss was made on that bar then that is considered to be a slightly
positive thing, and the chart gains a small positive diversity rating.
If a loss was also made on this chart, that is considered to be a negative thing
(two charts both losing money on the same indicates a lack of diversity), and the
chart's diversity rating decreases.
The result of all these calculations are presented at the top of the Portfolio Report,
in Diversity Ratings which are expressed as a percentage.
A Diversity Rating of 100% between two charts is nearly impossible
because it implies that on every losing bar of each chart, the other chart makes
a profit. A Diversity Rating of 100% for a portfolio of many instruments is even
more unlikely.
A Diversity Rating of between 30%-50% is considered good.
A Diversity Rating of between 20%-30% is considered poor.
A Diversity Rating below 20% is a warning that your portfolio is
not diversified.
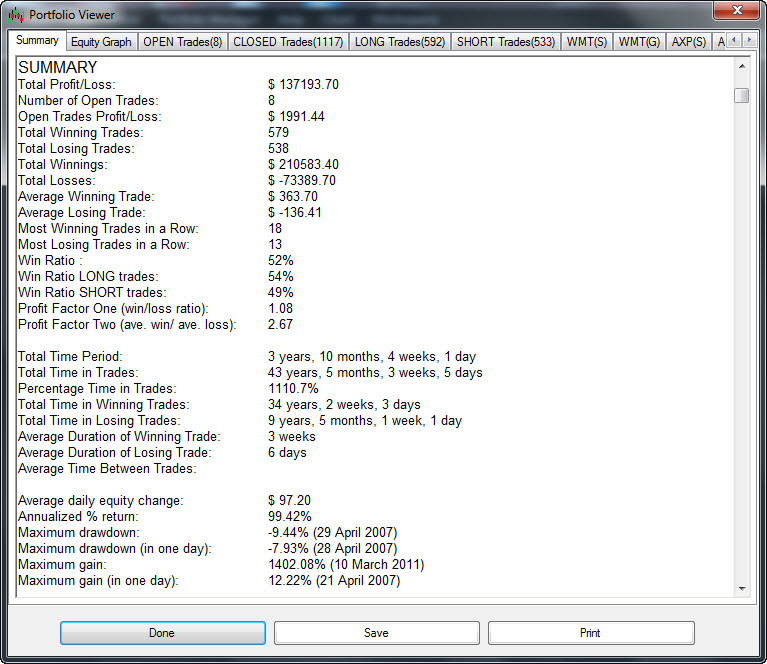
Summary
The following details of the portfolio's performance are provided in the summary:
Total Profit/Loss: the amount of money made or lost
Number of Open Trades: the number of open trades in the portfolio
Open Trades Profit/Loss: the profit or loss situation of all open
trades
Total Winning Trades: the number of winning trades
Total Losing Trades: the number of losing trades
Total Winnings: the total amount of money made by winning trades
Total Losses: the total amount of money lost in losing trades
Average Winning Trade: the average amount of money made in a winning trade
Average Losing Trade: the average amount of money lost in a losing trade
Most Winning Trades in a Row: the longest number of winning trades without a losing
trade
Most Losing Trades in a Row: the longest number of losing trades without a winning
trade
Win Ratio : the ratio of wins to losses as a percentage (50% would be an equal number
of winning and losing trades)
Win Ratio LONG trades: the ratio of wins to losses as a percentage (considering
long trades only)
Win Ratio SHORT trades: the ratio of wins to losses as a percentage (considering
short trades only)
Profit Factor One (win/loss ratio): the ratio of wins to losses expressed
as a ratio (1:1 would be an equal number of winning and losing trades)
Profit Factor Two (ave. win/ ave. loss): the average size of a winning trade expressed
as a ratio to the average size of a losing trade
Total Time Period: the time period from the beginning of the first trade to the
last bar of data (note this period is not from the beginning of the analysis because
if you have not built a trading history then this time period would be very deceptive)
Total Time in Trades: the amount of time actually spent with open positions
Percentage Time in Trades: the amount of time spent with open positions expressed
as a percentage. Note that it is possible, even likely that this figure
is over 100%. That is because Sentient Trader works out how much time is spent with
one trade open. In the example given above this figure is 1110% , meaning that effectively
the entire time period was spent with 11 trades open.
Total Time in Winning Trades: the amount of time spent in winning trades (note that
some of this time might have been spent with the trade in a losing position)
Total Time in Losing Trades: the amount of time spent in losing trades (note that
some of this time might have been spent with the trade in a winning position)
Average Duration of Winning Trade: the average time duration of a winning trade
Average Duration of Losing Trade: the average time duration of a losing trade
Average Time Between Trades: this is the average time you spent between trades (looking
for the next trading opportunity). In the case of a portfolio
it is likely that this figure is not given (as in the above example), indicating
that there was no time in which the portfolio had no open trades.
Average equity change (in one bar): the average amount of money that was made or
lost per bar (per day if the chart is a daily chart, per minute if the chart is
one-minute chart)
Annualized % return: this is the return on your investment expressed as a percentage
rate of return so that it can be compared with the return you might get from other
investments
Maximum drawdown: this is the amount in percentage terms and date (and time if intraday) of the biggest
downward move of your equity. In other words, measured from the previous highest
balance of your account, the biggest loss that was experienced in percentage terms.
Some trading advisers recommend that you double this figure and ask yourself whether
you are prepared to lose that much of your money. If the answer is no then you are
trading at too high a level of risk.
Maximum drawdown (in one bar): this is the biggest loss experienced in a single
bar (in one day if the portfolio consists only of daily charts, or one
minute if the portfolio consists only of one minute charts) in percentage terms.
Maximum gain: the opposite of the maximum drawdown is the maximum gain, also given
as a percentage, and the date (and time if intraday) on which this gain was experienced.
Maximum gain (in one bar): this is the biggest gain experienced in a single bar
(in one day if the portfolio consists only of daily charts, or one
minute if the portfolio consists only of one minute charts) in percentage terms.
The Equity Graph
The Equity Graph presents a graphic representation of the equity of your trading
account for the portfolio. There are three lines plotted on the Equity Graph:
The main equity line (which is colored blue by default. Sentient Trader uses the
color of the line-on-close chart style which you can change in the Options)
The drawdown line (which is colored red). This line shows on an intra-bar basis
what the drawdown on your account would have been. On days of high volatility the
line will be visible below the equity line.
The gain line (which is colored green). This line shows on an intra-bar basis what
the gain on your account would have been. On days of high volatility the line will
be visible above the equity line.
There are three buttons at the foot of the Portfolio Report:
Done: clicking in this button will close the report.
Save: this allows you to save each and every tab (or only selected
tabs) in the Portfolio Report for later perusal.
The summary pages can be saved in a rich text format (.rtf format) which can be opened in any word processing program
Equity graphs are saved as JPEG (.jpg format) images which can be viewed in any
graphics program.
Print: the various tabs of the Portfolio report can be printed.
Portfolio Management is not simply a matter of viewing the Portfolio Report. Take
a look at our suggestions for effective portfolio
management.