Once you have performed some trading with Sentient Trader, or after building a Trading
History, you will want to know some details about the trading that has been performed.
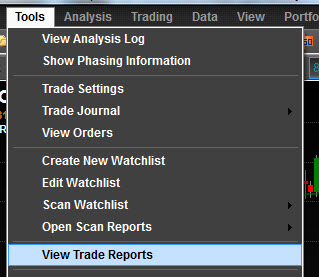
A great deal of detail is available in the form of a Trading Report. Open the Trading
Report for a chart with the menu Tools > View Trade Reports.
Sentient Trader will then compile the trading report for you.
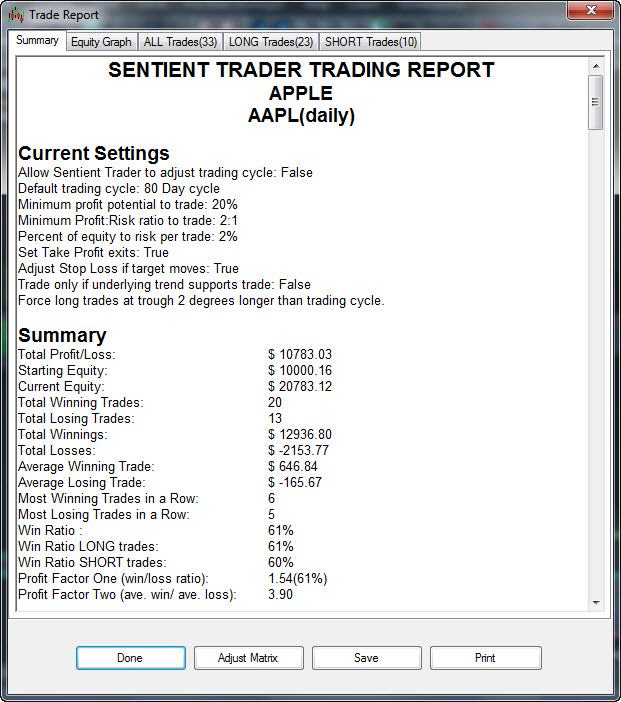
At the top of the Trading Report there are 5 tabs:
Summary: this is the default tab, on which is presented a summary
of the trading.
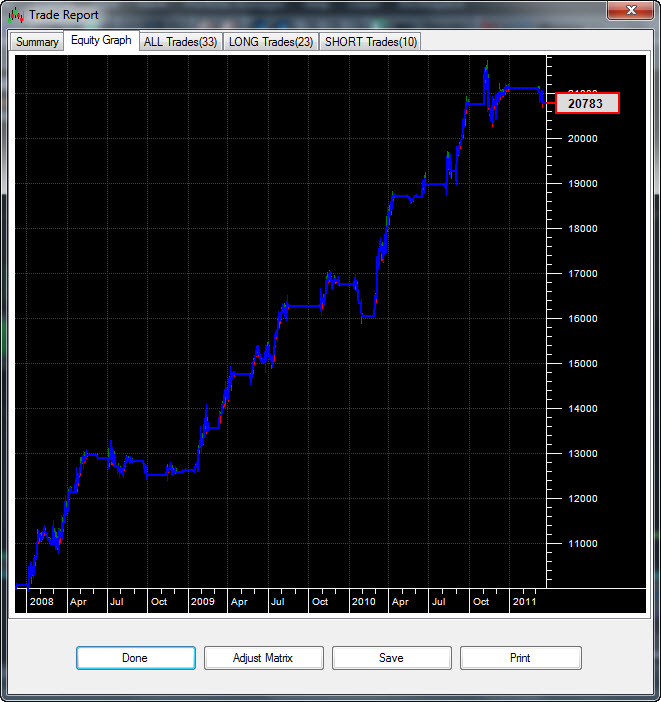
Equity Graph: this is a graph of the equity (balance) of the trading
account.
ALL Trades: all historical trades are presented in tabular format.
The number in brackets in the tab indicates how many trades there are.
LONG Trades: all historical long trades are presented in tabular
format. The number in brackets in the tab indicates how many long trades there are.
SHORT Trades: all historical short trades are presented in tabular
format. The number in brackets in the tab indicates how many short trades there
are.
The Summary
The summary page presents a great deal of information about the trading that has
been performed on the chart.
Current Settings
These are the current trading settings on the chart, which have of course influenced
the trading that has taken place. The settings are:
Allow Sentient Trader to adjust trading cycle.
Default trading cycle.
Minimum profit potential to trade.
Minimum Profit:Risk ratio to trade.
Percent of equity to risk per trade.
Set Take Profit exits.
Adjust Stop Loss if target moves.
Trade only if underlying trend supports trade.
Force long trades at trough x degrees longer than trading cycle.
Summary
The following details are provided in the summary:
Total Profit/Loss: the amount of money made or lost
Open Trade Profit/Loss: the profit or loss situation of an open
trade (if there is one)
Starting Equity: the amount of money the chart started trading with
Current Equity: the amount of money available now
Total Winning Trades: the number of winning trades
Total Losing Trades: the number of losing trades
Total Winnings: the total amount of money made by winning trades
Total Losses: the total amount of money lost in losing trades
Average Winning Trade: the average amount of money made in a winning trade
Average Losing Trade: the average amount of money lost in a losing trade
Most Winning Trades in a Row: the longest number of winning trades without a losing
trade
Most Losing Trades in a Row: the longest number of losing trades without a winning
trade
Win Ratio : the ratio of wins to losses as a percentage (50% would be an equal number
of winning and losing trades)
Win Ratio LONG trades: the ratio of wins to losses as a percentage (considering
long trades only)
Win Ratio SHORT trades: the ratio of wins to losses as a percentage (considering
short trades only)
Profit Factor One (win/loss ratio): the ratio of wins to losses expressed
as a ratio (1:1 would be an equal number of winning and losing trades)
Profit Factor Two (ave. win/ ave. loss): the average size of a winning trade expressed
as a ratio to the average size of a losing trade
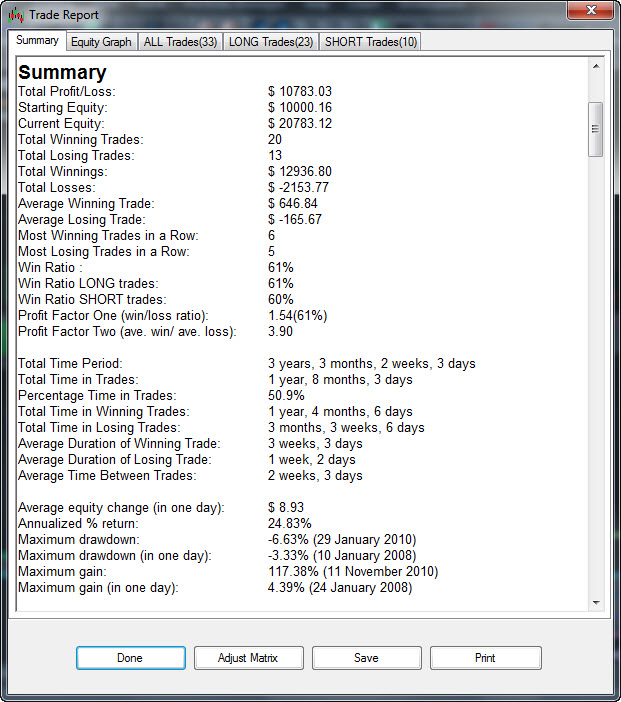
Total Time Period: the time period from the beginning of the first trade to the
last bar of data (note this period is not from the beginning of the analysis because
if you have not built a trading history then this time period would be very deceptive)
Total Time in Trades: the amount of time actually spent with open positions
Percentage Time in Trades: the amount of time spent with open positions expressed
as a percentage
Total Time in Winning Trades: the amount of time spent in winning trades (note that
some of this time might have been spent with the trade in a losing position)
Total Time in Losing Trades: the amount of time spent in losing trades (note that
some of this time might have been spent with the trade in a winning position)
Average Duration of Winning Trade: the average time duration of a winning trade
Average Duration of Losing Trade: the average time duration of a losing trade
Average Time Between Trades: this is the average time you spent between trades (looking
for the next trading opportunity)
Average equity change (in one bar): the average amount of money that was made or
lost per bar (per day if the chart is a daily chart, per minute if the chart is
one-minute chart)
Annualized % return: this is the return on your investment expressed as a percentage
rate of return so that it can be compared with the return you might get from other
investments
Maximum drawdown: this is the amount in percentage terms and date (and time if intraday) of the biggest
downward move of your equity. In other words, measured from the previous highest
balance of your account, the biggest loss that was experienced in percentage terms.
Some trading advisers recommend that you double this figure and ask yourself whether
you are prepared to lose that much of your money. If the answer is no then you are
trading at too high a level of risk.
Maximum drawdown (in one bar): this is the biggest loss experienced in a single
bar (in one day if the chart is a daily chart, or one minute if the chart is one-minute
chart) in percentage terms.
Maximum gain: the opposite of the maximum drawdown is the maximum gain, also given
as a percentage, and the date (and time if intraday) on which this gain was experienced.
Maximum gain (in one bar): this is the biggest gain experienced in a single bar
(in one day if the chart is a daily chart, or one minute if the chart is one-minute
chart) in percentage terms.
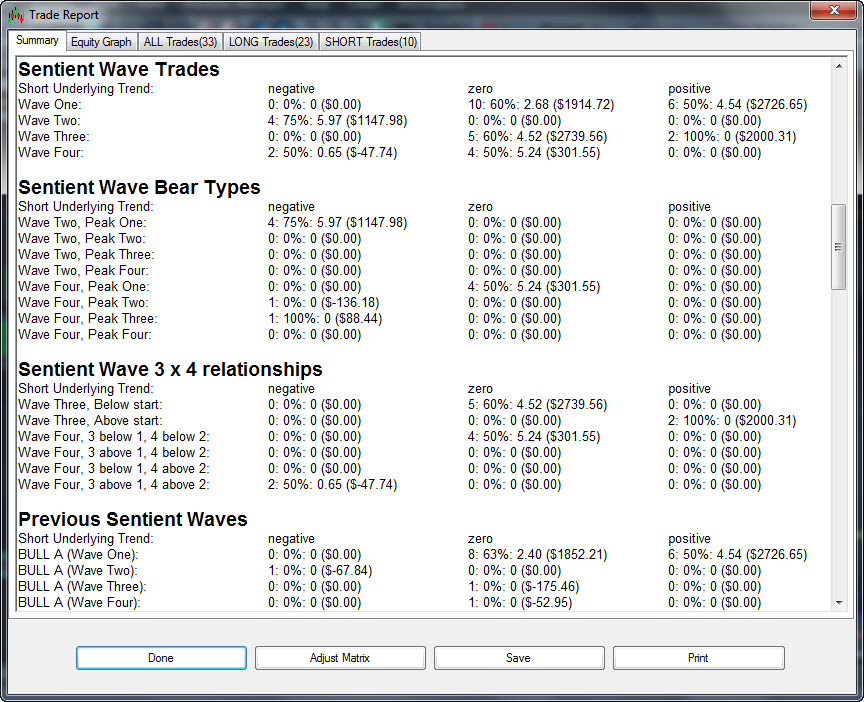
Sentient Trading Information
If you are using the Sentient Trading Methodology on the chart then information pertinent to the Sentient Trading Methodology is presented. This information is
presented in three columns, representing:
Negative Short Underlying Trend
Neutral Short Underlying Trend
Positive Short Underlying Trend
The information in each of these columns is presented as # of trades: % win ratio
(amount of money made or lost).
The following statistics relevant to the trading methodology are provided:
Details per Sentient Wave:
Wave One
Wave Two
Wave Three
Wave Four
Sentient Wave Bear Types
Wave Two:
Peak One
Peak Two
Peak Three
Peak Four
Wave Four
Peak One
Peak Two
Peak Three
Peak Four
Sentient Wave 3 x 4 relationships:
Wave Three:
Where wave three starts below the start of wave one
Where wave three starts above the start of wave one
Wave Four:
Where wave three starts below the start of wave one, and wave four starts below the start of wave two
Where wave three starts above the start of wave one, and wave four starts below the start of wave two
Where wave three starts below the start of wave one, and wave four starts above the start of wave two
Where wave three starts above the start of wave one, and wave four starts above the start of wave two
Previous Sentient Waves
BULL A (all four waves)
BULL B (all four waves)
BULL C (all four waves)
BULL D (all four waves)
BULL E (all four waves)
INVERTED BULL A (all four waves)
INVERTED BULL B (all four waves)
INVERTED BULL C (all four waves)
INVERTED BEAR A (all four waves)
INVERTED BEAR B (all four waves)
INVERTED BEAR C (all four waves)
BEAR A (all four waves)
BEAR B (all four waves)
BEAR C (all four waves)
BEAR D (all four waves)
BEAR E (all four waves)
The Equity Graph
The Equity Graph presents a graphic representation of the equity of your trading
account. There are three lines plotted on the Equity Graph:
The main equity line (which is colored blue by default. Sentient Trader uses the
color of the line-on-close chart style which you can change in the Options)
The drawdown line (which is colored red). This line shows on an intra-bar basis
what the drawdown on your account would have been. On days of high volatility the
line will be visible below the equity line.
The gain line (which is colored green). This line shows on an intra-bar basis what
the gain on your account would have been. On days of high volatility the line will
be visible above the equity line.
There are four buttons at the foot of the Trading Report:
Done: clicking in this button will close the trading report.
Adjust Matrix: this button allows you to adjust the matrix retrospectively
(see below), and is only enabled is the chart is using the Sentient Trading Methodology.
Save: the trading report can be saved in of two formats:
Rich text format (.rtf format) which can be opened in any word processing program
Comma separated value format (.csv format) which can be opened in any spreadsheet
program and is particularly useful for performing statistical calculations on the
Sentient Trading Methodology statistics.
Print: the trading report can be printed.
Adjusting the Matrix
By clicking on the Adjust Matrix button you can open a Trading
Matrix edit window, and adjust the matrix. When clicking on OK to confirm the Matrix
edit, a new trading report will be generated, using the original trading history,
filtered with the new matrix.
There is one difference with this Trading Report window, and that is that the
Adjust Matrix button is replaced with a Save to Chart
button. Clicking on that button will:
Replace the chart's Trading Matrix with the newly edited one.
Delete all historical trades that no longer match the new matrix.
Delete an open trade if it doesn't match the new matrix.
This effectively turns the trading history and situation of the chart in that of
the Trading Report.
Note that this process is not entirely realistic, because all you are doing is filtering
the original trading history with the new matrix. For this reason it is recommended
that one build a history using a full matrix, otherwise the end result would be
filtered twice - once during the initial building of the Trading History, and again
with the new matrix. And that double filtering is not realistic.