
In JM Hurst's Cycles Course Hurst presented a histogram-style chart at the foot of every chart which he called the Periodogram. The Periodogram is used in the first stages of Phasing Analysis to provide an indication of what cycles are present. Nowhere in Hurst's Cycles Course did he explain exactly how the Periodogram was generated, but he did give clues, and explained that the Periodogram was the result of a form of spectral analysis.
After extensive research into Hurst's work we have succeeded in replicating the process used to generate the Periodograms that Hurst provided, and Sentient Trader performs the spectral analysis required as the first stage of the analysis process.
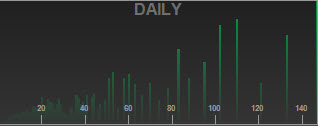
Sentient Trader produces several periodograms, one for each data resolution starting with the resolution of the chart's data. The number of time-frames is indicated along the x-axis, and the peaks in the histogram are an indication that cycles of those wavelengths have been found in the data. In the example above you will see a fairly clear peak at the 110 day mark. There is also a harmonically related peak at the 55 day mark. Sentient Trader uses the Periodogram to build an Initial Cyclic Model (as proposed by Hurst), and this example Sentient Trader would have built and Initial Cyclic Model with the nominal 20-week cycle at 110 days (19% short) and the nominal 80 day cycle at 55 days (also 19% short).
Periodograms can be viewed and saved, and their data exported for further analysis from the Analysis Summary Panel.