
A full phasing analysis consists of a great deal of information. Charts provide the information graphically of course, and the Analysis Summary provides the full information in text form, as an easy-to-read commentary. The Analysis Summary can be viewed at any time by using the menu View > Show Analysis Summary Panel.
The Analysis Summary Panel can be moved around the screen by clicking on the header bar of the panel, and dragging the panel in a similar manner to moving any window. The panel is an independent window and so it can be moved anywhere, even outside of the bounds of Sentient Trader.
By default the Analysis Summary Panel is pinned to stay on top of all other windows. You can un-pin the panel by clicking on the small pin icon in the header bar of the panel.
The Analysis Summary Panel is closed by clicking on the small right-facing arrowhead at the far right of the header bar of the panel.
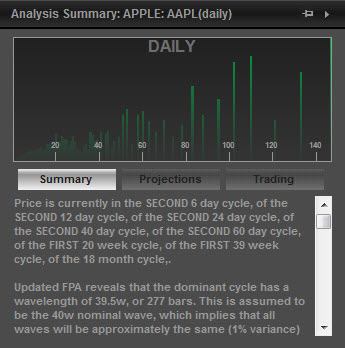
At the top of the Analysis Summary Panel there is a Periodogram.
Beneath the Periodogram there are three buttons, which select the commentary which is displayed in the lower commentary window. Three commentaries are available:
The information that is presented in the Analysis Summary is for the most recent bar only. If you would like to look back in time and view this information for a previous bar you can do that by viewing the Trading Journal.
This video describes the Analysis Summary Panel: