
This article was originally published in Technical Analysis of Stocks & Commodities, March 2011
In the 1970’s an American engineer called JM Hurst published a theory about why financial markets move in the way they do. The theory was the result of many years of research on powerful mainframe computers, and it became known as Hurst’s Cyclic Theory. Hurst claimed a 90% success rate trading on the basis of his theory, and yet the theory has remained largely undiscovered and often misunderstood.
Hurst published two seminal works: a book called The Profit Magic of Stock Transaction Timing, followed a few years later by a workshop-style course which was called the Cyclitec Cycles Course (now available as JM Hurst’s Cycles Course).
There are a number of very enthusiastic advocates, prominent traders and writers who proclaim Hurst as the “father of cyclic analysis” and confirm the efficacy of the theory (including the late Brian Millard who wrote several books about Hurst’s theory), but why is it that the theory isn’t better known and more widely used by technical analysts? There are, in my opinion, two reasons:
Hurst defined eight principles which like the axioms of a mathematical theory provide the definition of his cyclic theory.
In essence these principles define a theory which describes the movement of a financial market as the combination of an infinite number of “cycles”. These cycles are all harmonically related to one another (their wavelengths are related by small integer values) and their troughs are synchronised where possible, as opposed to their peaks. The principles define exactly how cycles combine to produce a resultant price movement (with an allowance for some randomness and fundamental interaction).
Perhaps the most distinguishing feature of Hurst’s cyclic theory is that it considers a combination of many cycles acting simultaneously upon price, rather than identifying and analyzing a single cycle. One of the consequences for most cyclic theories (which consider cycles in isolation from each other) is that cycles often seem to “disappear”. By contrast cycles never disappear according to Hurst’s theory, although they may at times be less apparent because of the way in which cycles combine.
The analysis of financial price movements performed upon the basis of Hurst’s theory is called a “Phasing Analysis” because it is a matter of determining the current phase of as many cycles as possible. The phase of a cycle is an indication of where that cycle is in its cyclical movement, more easily understood as “how long it has been since the last trough of the cycle”. Because cycles are cyclical, if we know how much time has passed since the last trough we can estimate how soon the next trough will occur, and whether the cycle under consideration is presently influencing price in an upwards or downwards direction.
Phasing analysis is the key to working successfully with Hurst’s cyclic theory. There are many other important aspects to the theory (such as the nominal model one is working with, and the trading methodology one applies), but at the heart of everything lies the phasing analysis.
The Profit Magic book has become something of a classic, probably because it offers the promise of helping the reader to truly understand the movements of financial markets. However the book presents a form of analysis that is based on a largely “mathematical” approach and which doesn’t result in the application of the full theory.
In the Cycles Course however the full theory is explained in great detail, and a different approach to the analysis is presented. This analysis process is truly the tour de force of Hurst’s work. It is an unfortunate irony that many enthusiastic readers of the Profit Magic book never progress to a study of the Cycles Course, because although the theory remains fundamentally the same it is the different approach to the analysis that provides the key to unlock the profits of the theory, and delivers on the promise made in the Profit Magic book of using cyclic analysis to truly understand the markets.
I describe the phasing analysis approach that Hurst presented in the Profit Magic book as “mathematical”, because it requires the plotting of several mathematically calculated displaced moving averages which are inflated to create constant depth channels around price – called Hurst envelopes. These channels are nested, and where they approach one another or themselves form a trough in their shape, a trough of the cycle (on which the channel is based) is positioned.
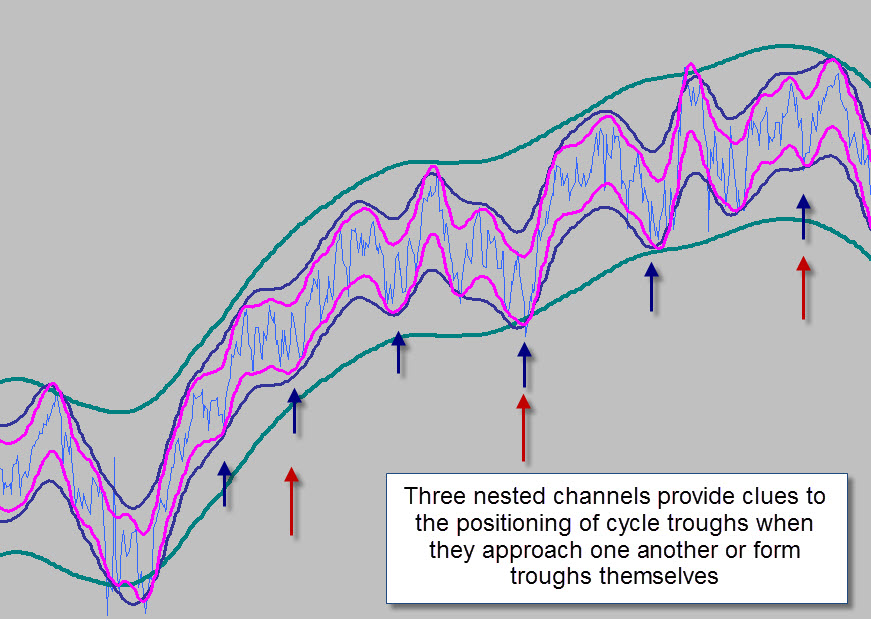
Figure 1: Nested channels are used to perform a rough phasing analysis.
This provides a basic phasing analysis, and then the moving averages are used to create projections. Because the moving averages are displaced back in time, they need to be extrapolated forward to potential points of intersection which provide the projections for future price movement. Figure 2 illustrates how well these projections work with the benefit of hind-sight.
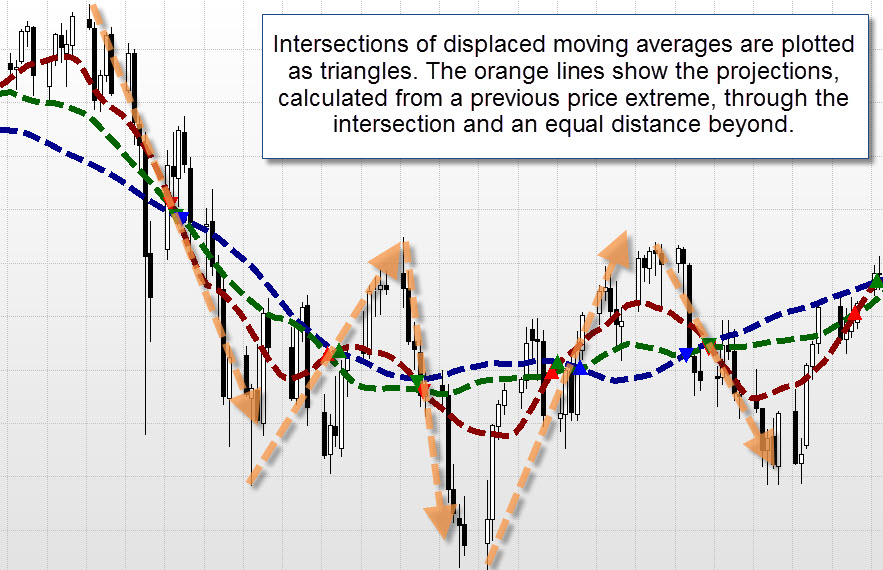
Figure 2 : During periods of well-defined cyclic action in the market, the intersections of displaced moving averages provide good price projections.
Figure 3 demonstrates the potential weaknesses of the approach.
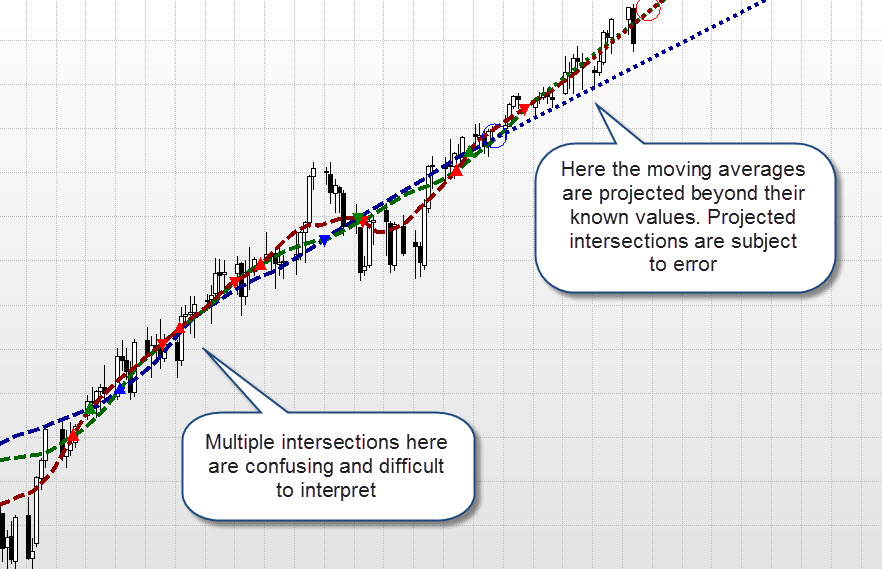
Figure 3 : During periods of less well-defined cyclic action in the market, the intersections of displaced moving averages provide very poor price projections (and yet the cycles are still active).
And so two vital conditions need to be met for this process to work for a trader (without the benefit of hindsight):
There are times when these conditions are met, and so the process works well, but there are also times where the conditions are not met. And so this process is all very well, but it doesn’t begin to tap into the true power of Hurst’s Cyclic Theory.
In the Cycles Course Hurst advocated a different analytical approach, a process which is simple in essence, and is based upon a form of pattern recognition and the application of an advanced (hopefully) human brain to the resolution of complex dilemmas.
The pattern recognition approach involves three stages:
Entry Stage : First of all the analyst identifies major troughs (“visually evident” troughs because they can be seen clearly) of the longest cycle that appears to be present in the data (Hurst called this the dominant cycle). If a particular expected trough is not apparent, or there is ambiguity in the positioning of the trough the positioning of this trough is postponed until the analyst has more detailed information.
Extension Stage : The analyst then considers the next shorter cycle in the cyclic model, and identifies the troughs of that cycle using the previously positioned troughs of the longer cycle as anchoring points. The positioning of shorter cycle troughs often resolves the positioning of the longer cycle troughs, and so the analyst is constantly moving between the cycles, but generally moving from the longest (dominant) cycle down to the shortest cycle.
Completion Stage: Having resolved the shortest cycle visible in the data (the 5-day cycle if one is working with daily data), the analyst reverses the direction of the process, and resolves the position of all the longer cycles.
It is this different approach that provides the true key to Hurst’s cyclic theory because it presents a complete “cyclic model”: it informs the analyst of the phasing of all known cycles, not merely the phasing of one or two cycles. By understanding the complete picture (as complete as is possible, given limitations on available data) the analyst can trade according to how the cycles COMBINE to influence price.
Having performed a phasing analysis, the results are plotted on a chart using a notation system proposed by Hurst, involving the placing of diamonds beneath the price to represent the troughs of the various cycles. The higher the pile of diamonds, the longer the cycle which is forming a trough at that point.
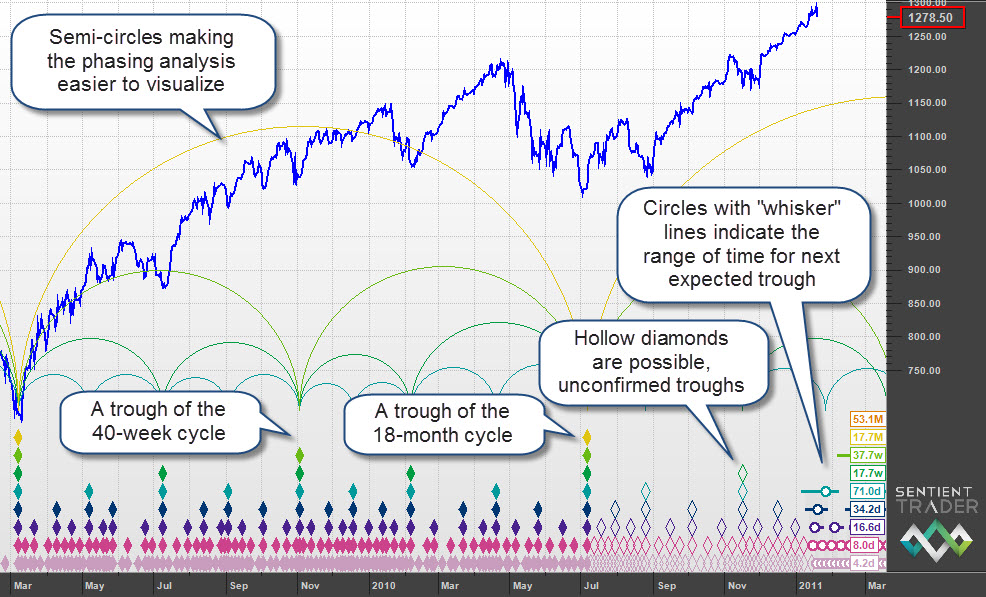
Figure 4: This full phasing analysis presents the complete cyclic picture, using Hurst’s diamond notation for marking the positions of troughs. Cycles should never be considered in isolation when using Hurst’s cyclic theory.
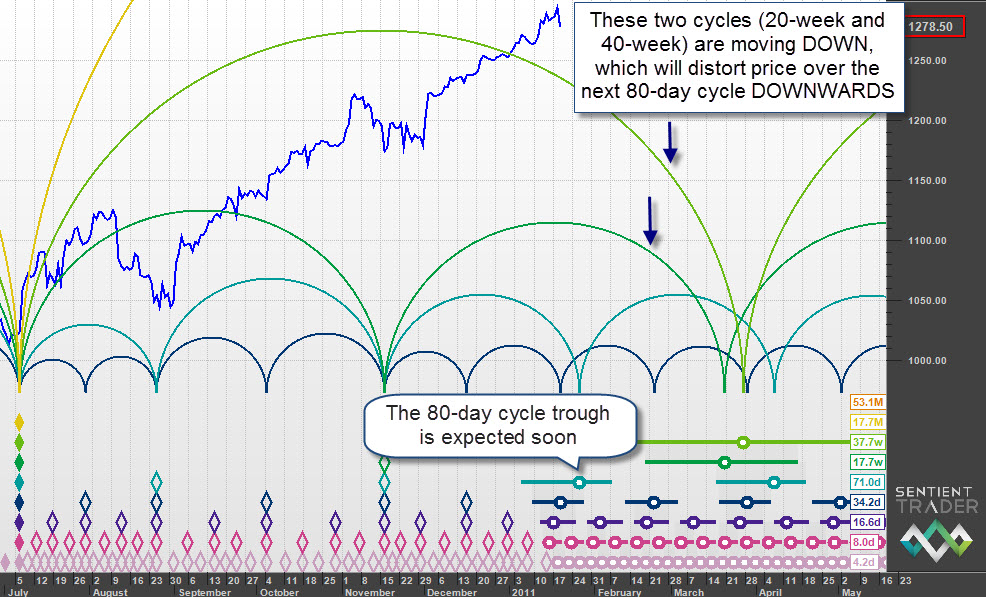
Figure 5: A trough of the 80-day cycle is expected soon. However this does NOT mean that the market will rise for 40 days! Longer cycles are pressing DOWN, and so the rise out of the 80-day cycle trough is likely to be brief and disappointing.