
This article was originally published in Technical Analyst, February 2011
JM Hurst was an American aeronautical engineer who proposed a cyclic theory about the workings of financial markets in the 1970’s and is considered by many to be the father of cyclic analysis. He published two seminal works: a book called The Profit Magic of Stock Transaction Timing, and a few years later a workshop-style course which was called the Cyclitec Cycles Course (now available as “JM Hurst’s Cycles Course”).
The Profit Magic book has become something of a classic, and it presents aspects of Hurst’s cyclic theory in what might be described as its “early form”. It is an exciting read because it makes so much sense and for someone seeking to truly understand the movements of financial markets it offers the promise of doing just that. But it is also a little frustrating because it fails to deliver entirely on that promise. In some places references are made to a more complete theory, and to the use of cyclic tools such as something called the FLD, which is not clearly defined, and cyclic calculations are mentioned but not fully explained.
It is in the Cycles Course that the full theory is explained in great detail, and this truly is the tour de force of Hurst ’s work. Ironically while the Profit Magic book was becoming a classic, the Cycles Course disappeared from the public eye, and was only republished almost thirty years later in the early 2000’s. Ironic because most of the questions posed by the Profit Magic book are answered in the Cycles Course, and the Cycles Course delivers on the promise of enabling an analyst to truly understand what is happening in the markets. This understanding importantly includes an awareness of what one doesn’t know, because it is implicit in Hurst’s cyclic theory that it is impossible to know absolutely everything about the cycles which are active in any market. Fortunately it is possible to know enough about the cycles to be able to trade the market successfully.
If Hurst’s cyclic theory offers so much, why is not more widely known? The answer to that question probably lies in the combination of two considerations: firstly, Hurst’s cyclic theory is not simple. The basic concepts are beautifully simple, even elegant. But it takes most people several months of concerted study to work through the Cycles Course which is over 1,500 pages long. The second consideration is that the analysis process presented by Hurst is something that one has to learn and it is a skill that one needs to develop and refine, not a purely mechanical or mathematical process. The theory hasn’t provided an automatic system-type solution to our modern quick-information, reduce everything to a system society. But for those willing to approach the markets armed with a theory that requires the development of a particular analytical skill, and which allows for a fair degree of uncertainty, Hurst’s cyclic theory is well worth the effort.
Hurst defined eight principles which like the axioms of a mathematical theory provide the definition of his cyclic theory. In essence these principles define a theory which describes the movement of a financial market as the combination of an infinite number of “cycles”. These cycles are all harmonically related to one another (their wavelengths are related by small integer values) and their troughs are synchronised where possible, as opposed to their peaks. The principles define exactly how cycles combine to produce a resultant price movement (with an allowance for some randomness and fundamental interaction).
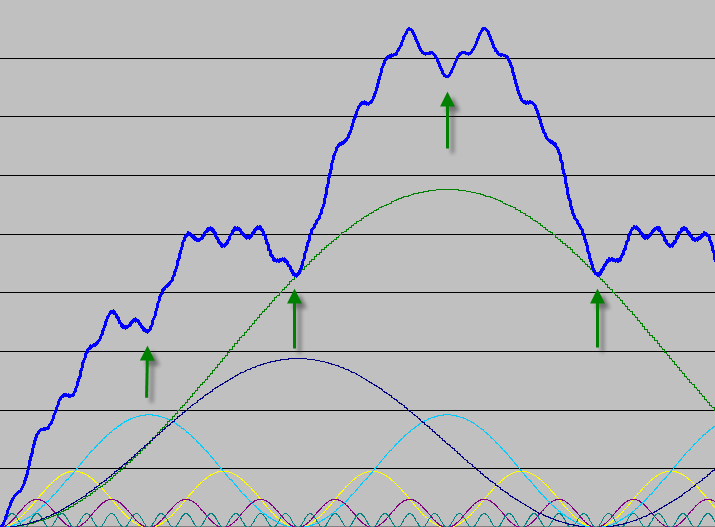
Figure 1: Six cycles combined according to Hurst ’s principles to produce a composite “price” movement. The green arrows represent buying points at the troughs of the “yellow” cycle. Price movement out of the trough (and trade potential) is different for each trough because of underlying trend.
These simple rules distinguish Hurst ’s theory from any other cyclic theory. For instance most cyclic theories consider cycles in isolation from each other, and cycles are often seem to “disappear”. By contrast cycles never disappear according to Hurst’s theory, but they may be less apparent because of the way in which cycles combine. It is the fact that Hurst’s theory stipulates that there are an infinite number of cycles that makes it particularly different, and also begins to explain why it is impossible to forecast price movement with 100% accuracy. Just as it is impossible to conceive of the sum of two infinite numbers, it is impossible to define the result of combining an infinite number of cycles.
The true genius of Hurst’s theory as presented in the Cycles Course was in the way that he proposed an analysis should be conducted. The analysis is called a “Phasing Analysis” because it is matter of determining the current phase of as many cycles as possible. Hurst advocated a process which is simple in essence, and is based on a form of pattern recognition and the application of an advanced (hopefully) human brain to the resolution of complex dilemmas. This method differs from the approach he presented in the Profit Magic book which was purely “mathematical” in that it required the plotting of a displaced moving average (inflated to create channels around price – the well known Hurst envelopes). It is this different approach that provides the true key to Hurst ’s cyclic theory. This approach elevates analysis from a mathematical process to a skill (perhaps even an art) which the analyst strives to refine and perfect.
Having performed a phasing analysis, the results are plotted on a chart using a notation system proposed by Hurst , involving the placing of diamonds beneath the price to represent the troughs of the various cycles. And then one moves on to the second aspect of Hurst ’s theory: making trading decisions on the basis of the cyclic analysis.
This aspect of Hurst ’s theory is once again distinguished from other cyclic theories. Most cyclic theories advocate buying a market when the cycle is rising, and selling when the cycle is falling. Hurst’s trading methodology on the other hand takes into account the fact that price is the result of a composite of many cycles, and only advocates buying when a cycle is rising, and the two cycles longer than the trading cycle (in the harmonic collection of cycles) are also rising. Similarly one should only sell (go short the market – exits are a different matter) when the two cycles longer than the trading cycle are also falling. There are further guidelines to be observed before selling short, because of the principle of synchronicity which tells us that troughs are synchronised – and therefore much easier to trade, whereas peaks are not synchronised and are therefore more complicated to identify, and much more difficult to trade.
Beyond the above overall guideline as to when one should enter the market, trading according to Hurst’s cyclic theory requires that one times one’s trading actions by means of using two cyclic tools: the FLD (Future Lines of Demarcation) and the VTL (Valid Trend Line). These tools provide evidence of a cyclic nature that a trough or peak of a particular cycle has occurred, and so they are used to create what Hurst called “action signals” – when price crosses an FLD or VTL a signal is generated, whereupon one should take an action (such as buying or selling).
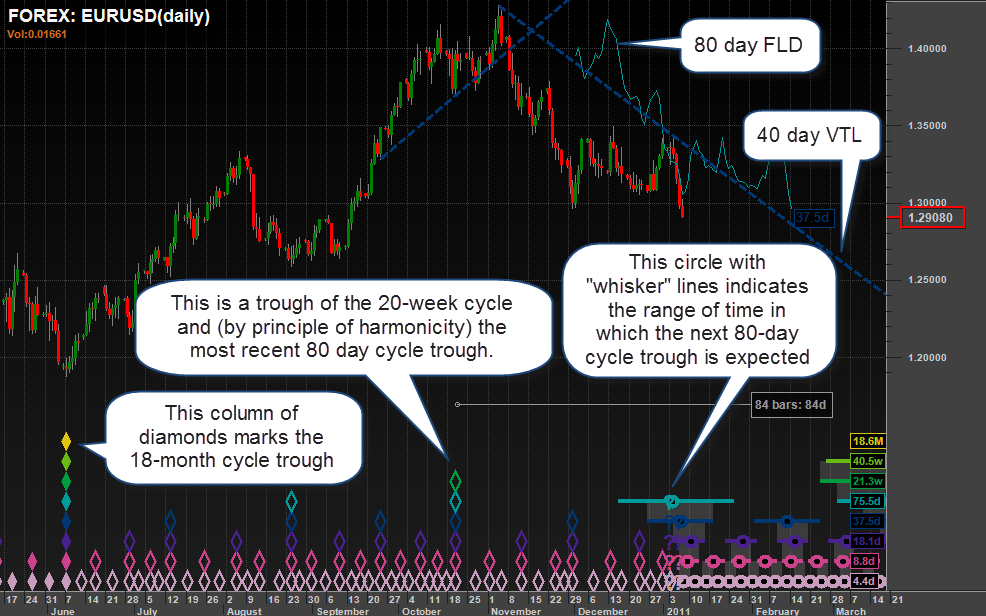
Figure 2: The Euro to US Dollar forex pair with a cyclic analysis presented in Hurst’s diamond notation. Each diamond represents a trough of a cycle. As of the 7th of January a trough of the 80-day cycle is expected (it has been 84 days since the previous trough). The 40-day VTL and 80-day FLD are plotted.
This is all very well, but if one were to wait for evidence that one’s trading cycle had experienced a trough (by waiting for price to cross the FLD or VTL applicable to that cycle) then one would have missed a good deal of the price move. This is where the true beauty of Hurst ’s principles emerges. Because of the principle of synchronicity (which states that troughs are synchronised) one knows that the trough of the trading cycle will be synchronised with the troughs of several shorter cycles. Therefore when evidence is received that a trough of a much shorter cycle has occurred (by price crossing the FLD or VTL applicable to that shorter cycle) then one can take action. Because of the shorter wavelength of this synchronous trough one catches much more of the price move.
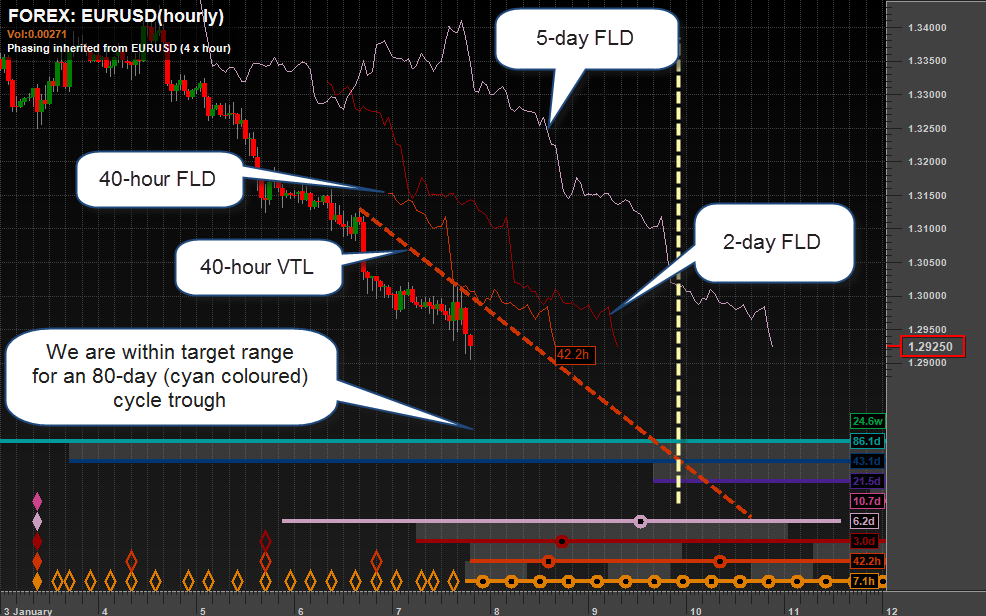
Figure 3: The Euro to US Dollar forex pair in more detail. An hourly chart with the FLD’s of the 40 hour, 3 day and 5 day cycles plotted, and the VTL of the 40 hour cycle. These lines provide good entry levels for trading the move out of the expected 80 day trough. The vertical dashed line represents the time at which trading will commence on Sunday night.
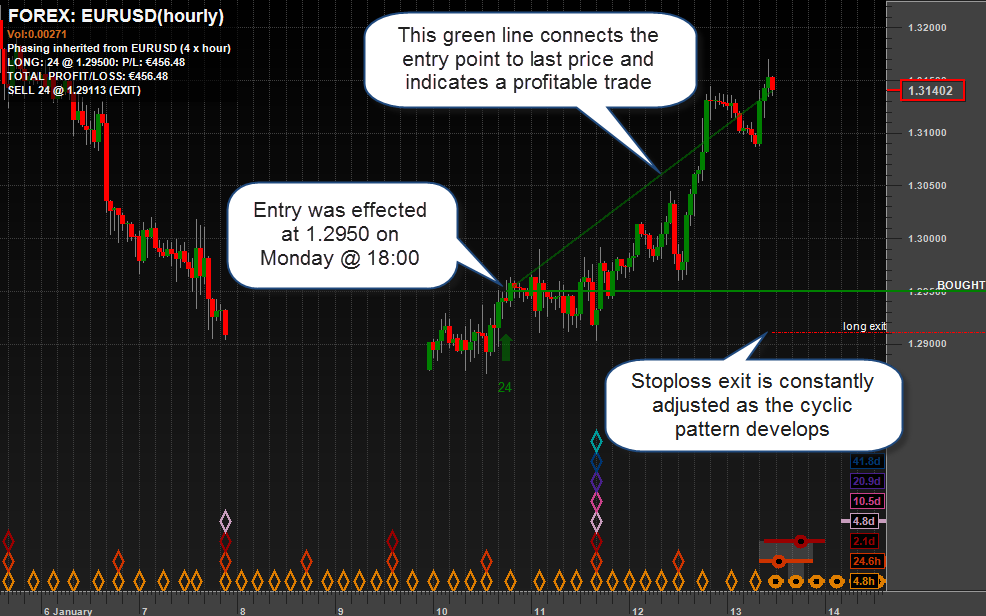
Figure 4: On Monday the market is rising out of the trough, and a long entry is effected at a level determined by the 2-day FLD. A stop-loss exit is positioned according to cyclic principles.
Hurst published his theory almost 40 years ago, and it is a testament to the validity of the theory that it can be applied effectively to the markets today. Of course now we have the extra benefit of being able to work with the power of modern computers. It has been an exciting and rewarding experience to extend Hurst ’s theory into the realm of intraday analysis, a journey which has presented many challenges. For instance, it is a feature of Hurst’s cyclic theory that cycles move through time, regardless of whether we are trading financial markets or not. A cycle keeps moving through the weekend, but we have no evidence of it because we aren’t trading. When analysing daily data this is not much of a problem, but when analysing intraday data it becomes a fairly big problem. On a Monday morning one is faced with a gap of over 60 hours in most markets, during which time there would have been a good deal of cyclic activity. There would have been 7 or 8 full waves of the 8 hour cycle, and if that cycle is your chosen trading cycle, Mondays present an interesting challenge: it will usually take several hours to identify the current phasing of the 8 hour cycle.
Another advantage of working with the power of modern computing is that one can apply that power to refine the trading methodology that Hurst created. By going back through an analysis of a market one can define the character of that market by observing how the price has reacted to the cycles that are defined in the analysis. Under various conditions of what Hurst called “underlying trend” (which is an indication of the current phasing of cycles longer than the trading cycle) one can define statistically how price in this particular market behaved. This information can then be used to filter potential trades, which are still taken on the basis of Hurst ’s original methodology (using cyclic tools to provide evidence of a trough or peak of a cycle). The result is a trading methodology which adapts to the cyclic character of the individual market.
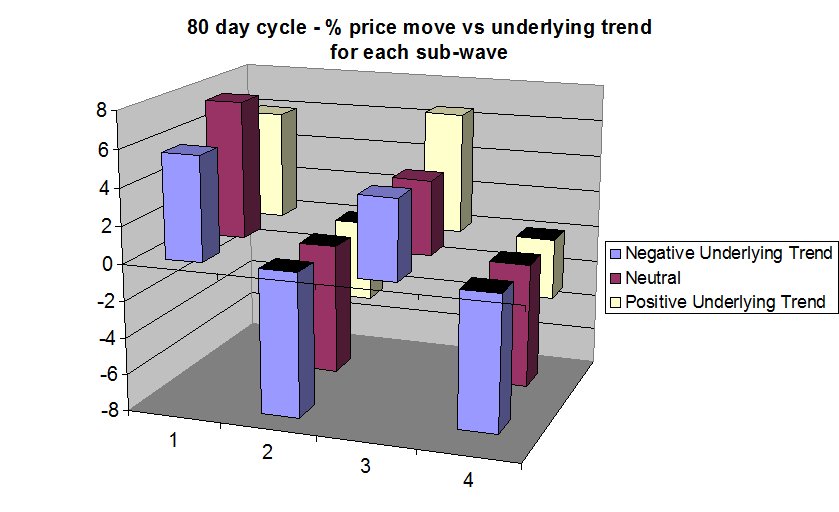
Figure 5: The cyclic “character” of a market. The percentage price move for each of four sub-cycles of the 80-day cycle in different underlying trend conditions. It can be seen that stronger positive moves are generally experienced when there is a positive underlying trend, and stronger negative moves when there is a negative underlying trend.
Filtering trades in this manner proves to be very effective, but of course how effective depends very much upon one thing: the phasing analysis which is forming the basis for the trading signals. Because in the world of Hurst’s cyclic theory, all roads lead to the Phasing Analysis!