
On completing the forecast scan of a watchlist,
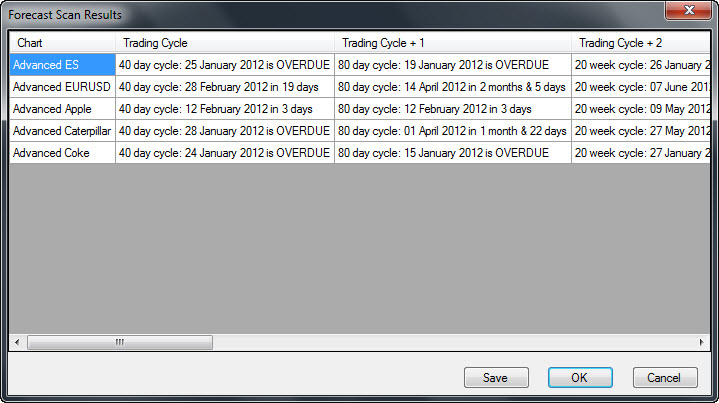
Sentient Trader will present you with a single report window:
This is a table which has a row for each chart in every workspace scanned. It presents the next expected date (and time if the chart is
an intraday chart) of the troughs of each cycle from the trading cycle and longer
(up to the longest cycle found in the chart). The information is drawn from the
chart's phasing analysis, and so if a trough is expected but not confirmed it will
be presented in this scan, even if trading orders have been generated on the assumption
that the trough has already occurred (but is not yet confirmed).
This information can be used to schedule your expected trading activity, particularly
useful for traders working with intraday charts, who would want to ensure they are
watching the appropriate workspaces when the longer cycles are expected to come
in.
Getting Started Roadmap for Trader Edition